400+ Cybersecurity Compliance Statistics – October 2026
Updated:
October 15, 2026
Compliance requirements grew more complex over the past three years for 85% of executives, and 38% of organizations have lost revenue or a competitive bid because they lacked a required certification. Bright Defense pulled together 400+ cybersecurity compliance statistics from 2025 and 2026 research, each cited to its source, so you can benchmark your program, size your next budget request, or back a business case with current numbers. The statistics cover:
- The Current State of Compliance
- Regulatory Complexity
- Business Value and the Cost of Noncompliance
- Audits, Program Maturity, and Budgets
- Staffing, Workload, and the Cybersecurity Skills Gap
- Board Oversight, Speak-Up Culture, and Training
- Compliance Automation, AI in Compliance, and AI Governance
- Cybersecurity Readiness and Data Privacy
- DORA Readiness
- Third-Party Risk and SaaS Supply Chain Security
- Framework Adoption and Framework-Specific Data for SOC 2, ISO 27001, NIST, PCI DSS, CMMC, and HIPAA
- Compliance Trends for 2026
Key Compliance Statistics
- 97% of surveyed organizations run at least two compliance audits a year. (Source: A-LIGN Compliance Benchmark Report 2026)
- 62% of respondents say achieving compliance is required to win new contracts or renew existing ones. (Source: Secureframe Cybersecurity and Compliance Benchmark Report 2026, full-data appendix)
- 52% of surveyed companies are compliant with more than one framework. The framework-count breakdown elsewhere in the report covers frameworks achieved or in progress. (Source: Secureframe Cybersecurity and Compliance Benchmark Report 2026)
- 58% of surveyed organizations expect GRC spending to rise during 2026. (Source: Hyperproof IT Risk and Compliance Benchmark Report 2026)
- 50% of surveyed organizations running ad hoc or incident-driven risk management suffered a breach in 2025, compared with 27% of surveyed organizations running an integrated, automated approach. (Source: Hyperproof IT Risk and Compliance Benchmark Report 2026)
- 88% of C-suite respondents view their compliance program as a strategic advantage. (Source: NAVEX State of Risk and Compliance Report 2026)
- 78% of compliance teams take part in organizational AI decisions, up from 65% a year earlier. (Source: NAVEX State of Risk and Compliance Report 2026)
- 64% of surveyed organizations assess the security of AI tools before deployment, up from 37% in 2025. (Source: World Economic Forum Global Cybersecurity Outlook 2026)
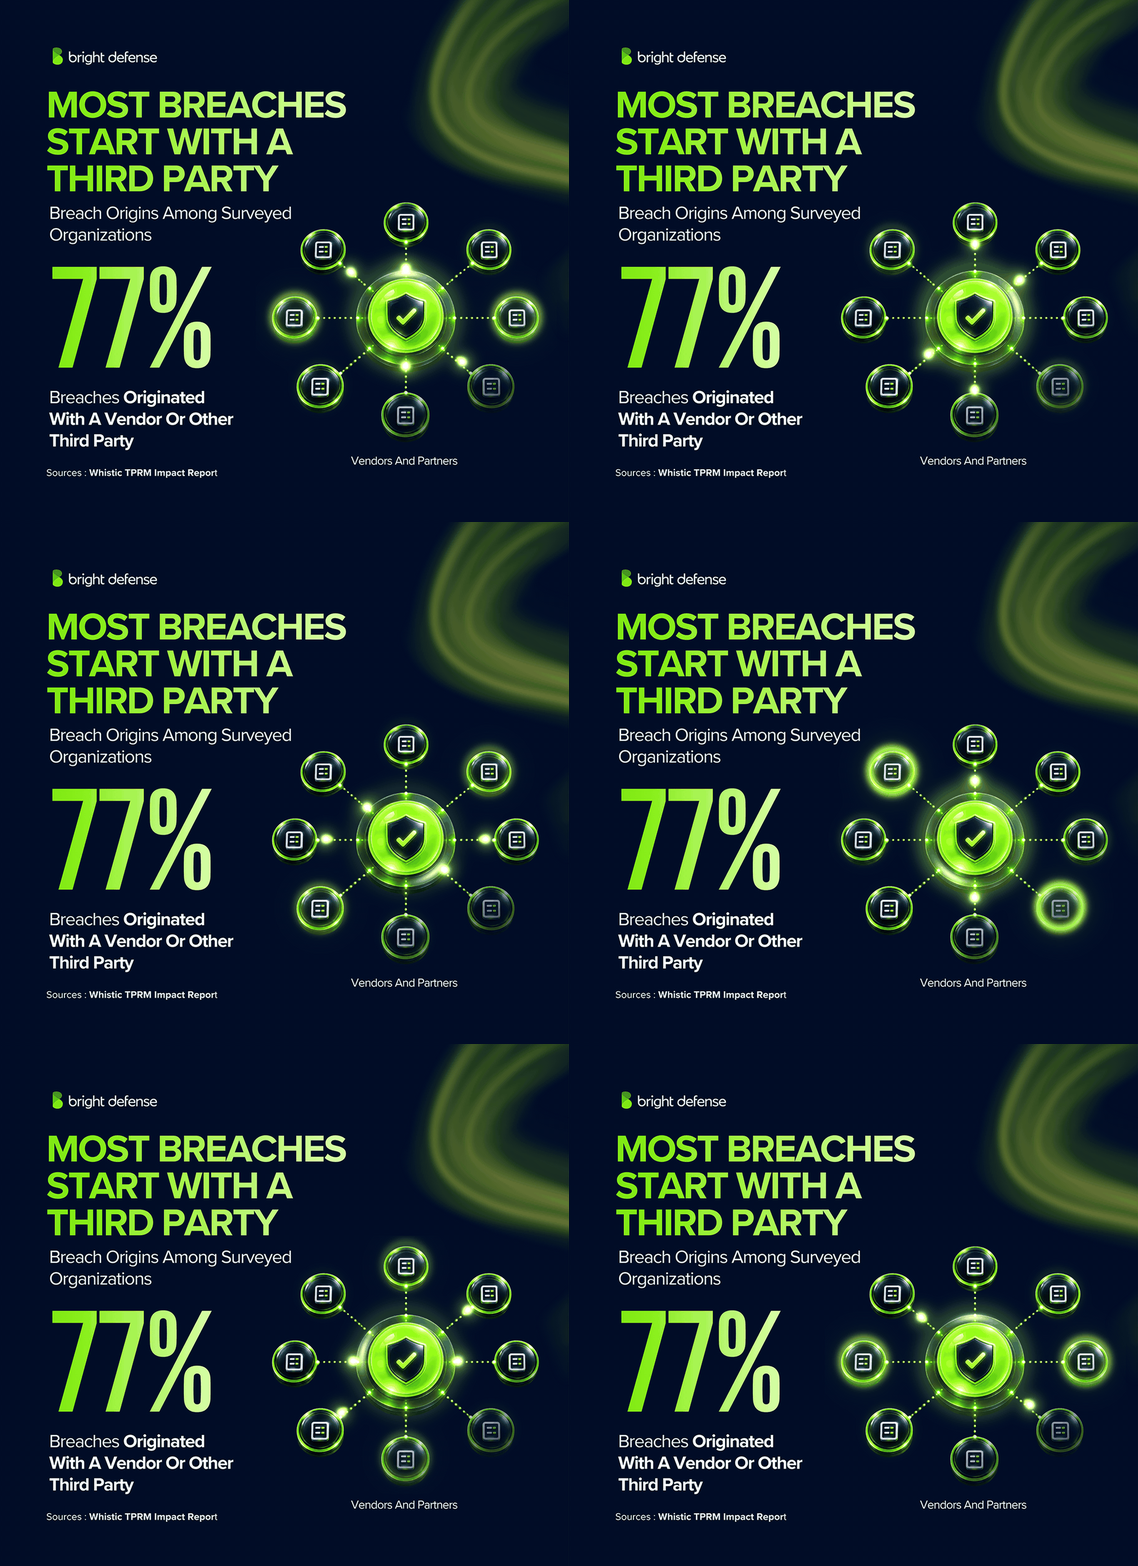
- 77% of breaches at organizations in Whistic’s survey originated with a vendor or another third party. (Source: Whistic Third-Party Risk Management Impact Report 2025)
- 4% of surveyed organizations reach the Mature stage of overall cybersecurity readiness. (Source: Cisco Cybersecurity Readiness Index 2025)
- Security and compliance teams spend 12 working weeks a year on compliance tasks, up from 10 the year before. (Source: Vanta State of Trust Report 2025)
- 53% of legal entity compliance practitioners handle more than 60% of their governance workload manually through spreadsheets, email, and document templates. (Source: Diligent Global State of Legal Entity Compliance 2026)
The Current State of Compliance
- Nearly 90% of executives say the breadth of their compliance responsibilities increased over the past three years. (Source: PwC Global Compliance Survey 2025)
- 51% rank cybersecurity among their five leading compliance-risk priorities, and the same share rank data protection and privacy. (Source: PwC Global Compliance Survey 2025)
- 40% rank corporate governance as a leading compliance priority. (Source: PwC Global Compliance Survey 2025)
- 38% rank anti-bribery, anti-corruption, anti-money laundering, or fraud risk as a leading compliance priority. (Source: PwC Global Compliance Survey 2025)
- 59% say better coordination of compliance activities gives them more confidence in compliance decisions. (Source: PwC Global Compliance Survey 2025)
- 86% of surveyed organizations run a centralized team for governance, risk, and compliance. (Source: Hyperproof IT Risk and Compliance Benchmark Report 2026)
- 93% of compliance functions take part in organizational risk assessment and management, and 70% describe that involvement as highly engaged. (Source: NAVEX State of Risk and Compliance Report 2025)
- 74% of legal entity compliance and governance practitioners say their scope expanded over the past two years. (Source: Diligent Global State of Legal Entity Compliance 2026)
- 56% of legal entity practitioners see themselves as strategic advisers to the board. (Source: Diligent Global State of Legal Entity Compliance 2026)
- 17% of legal entity practitioners believe leadership fully shares that view of their role. (Source: Diligent Global State of Legal Entity Compliance 2026)
- 52% of legal entity practitioners say leadership underestimates the complexity of entity and subsidiary governance. (Source: Diligent Global State of Legal Entity Compliance 2026)
- 68% of C-suite leaders say time-consuming compliance and reporting work limits the effectiveness of enabling functions. (Source: Thomson Reuters C-Suite Survey 2025)
- 17% of C-suite leaders rank simplifying that compliance and reporting work as their most important improvement opportunity. (Source: Thomson Reuters C-Suite Survey 2025)
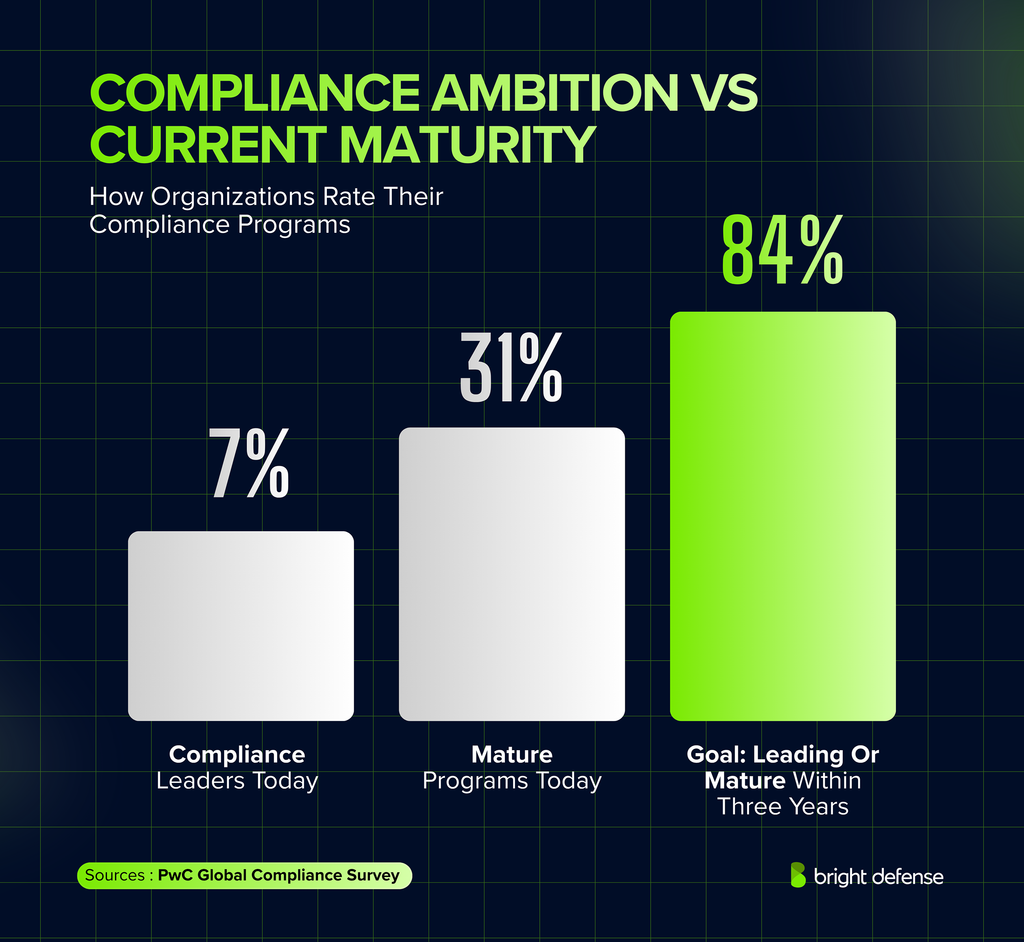
- 84% of surveyed organizations aim to reach a leading or mature compliance position within three years. (Source: PwC Global Compliance Survey 2025)
- 7% of surveyed organizations describe themselves as compliance leaders today. (Source: PwC Global Compliance Survey 2025)
- 31% of surveyed organizations describe their compliance programs as mature today. (Source: PwC Global Compliance Survey 2025)
Regulatory Complexity Statistics
- Nearly 90% of executives say compliance complexity hurts their ability to implement and maintain IT systems and data. (Source: PwC Global Compliance Survey 2025)
- 82% say compliance complexity diverts senior management’s attention. (Source: PwC Global Compliance Survey 2025)
- 81% say compliance complexity hurts business transformation and change initiatives. (Source: PwC Global Compliance Survey 2025)
- 77% say compliance complexity hurts their organization across growth, transformation, resources, systems, and business relationships. (Source: PwC Global Compliance Survey 2025)
- 76% say regulatory complexity hurts the creation and upkeep of third-party relationships and alliances. (Source: PwC Global Compliance Survey 2025)
- 67% say compliance requirements restrict their organization’s adoption of artificial intelligence. (Source: PwC Global Compliance Survey 2025)
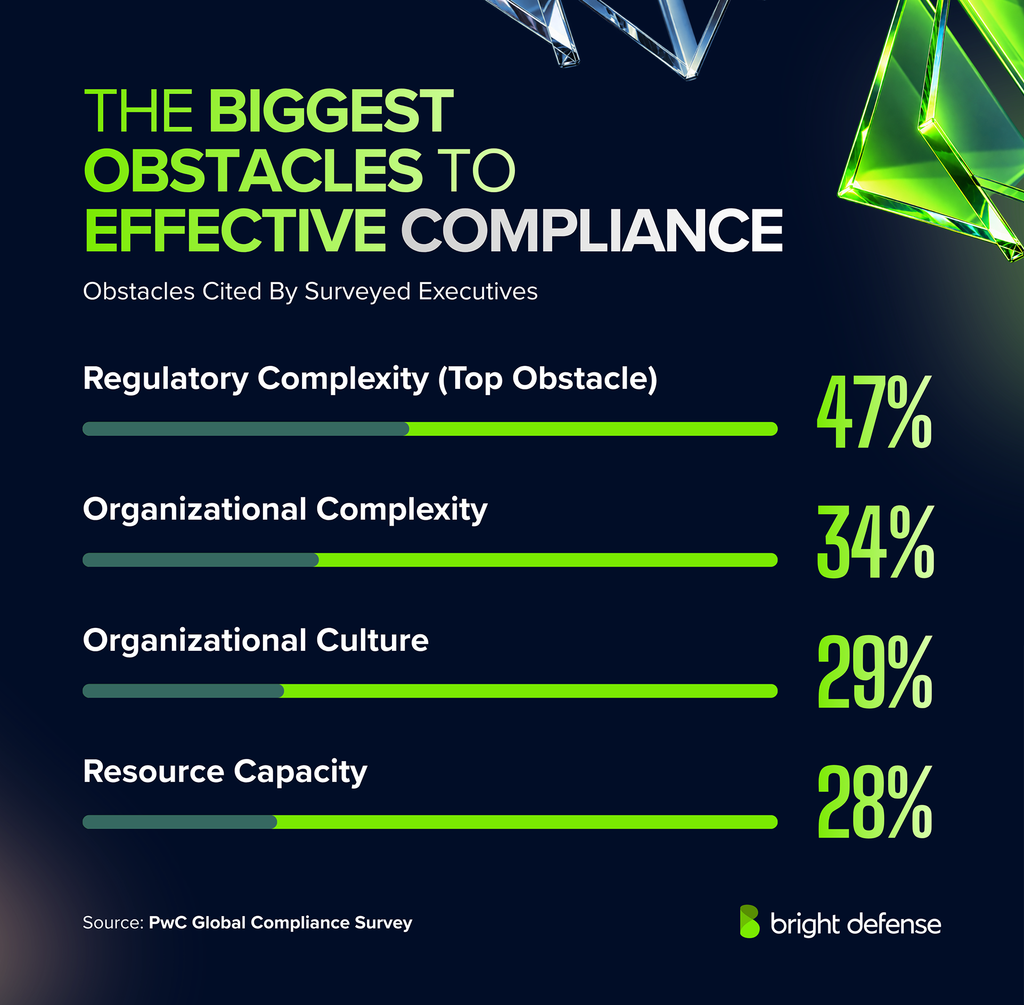
- Regulatory complexity is the leading obstacle to effective compliance for 47% of respondents. Other obstacles rank as follows: (Source: PwC Global Compliance Survey 2025)
- Organizational complexity: 34%
- Organizational culture: 29%
- Resource capacity: 28%
- 63% of executives say complex, disaggregated organizational data makes compliance harder. (Source: PwC Global Compliance Survey 2025)
- 56% cite data reliability and quality as a compliance challenge. Related data challenges: (Source: PwC Global Compliance Survey 2025)
- Limited data availability: 47%
- Insufficient data skills or experience: 47%
- 42% of surveyed organizations using compliance technology spot and respond to regulatory changes faster. (Source: PwC Global Compliance Survey 2025)
- 46.3% of legal entity practitioners rank rising regulatory complexity among their top three compliance challenges. (Source: Diligent Global State of Legal Entity Compliance 2026)
- 37.2% of legal entity practitioners struggle to keep pace with regulatory change. (Source: Diligent Global State of Legal Entity Compliance 2026)
- 23.6% of legal entity practitioners name cross-border compliance obligations as a leading challenge. (Source: Diligent Global State of Legal Entity Compliance 2026)
- 19% of legal entity practitioners have near-real-time visibility into their compliance obligations. (Source: Diligent Global State of Legal Entity Compliance 2026)
- 46% of legal entity practitioners have real-time visibility into less than 40% of their obligations. (Source: Diligent Global State of Legal Entity Compliance 2026)
- 47.9% of legal entity practitioners call regulatory change management a critical capability for the next three years. (Source: Diligent Global State of Legal Entity Compliance 2026)
- 21% of financial services compliance and risk leaders rate their regulatory change management approach as somewhat or highly ineffective. (Source: CUBE Cost of Compliance Report 2025)
- 98% of financial services firms automate at least part of their regulatory change management process. (Source: CUBE Cost of Compliance Report 2025)
- Financial services firms take more than 1 year, on average, to fully implement a regulatory change. (Source: CUBE Cost of Compliance Report 2025)
- 16% of financial services firms send potential regulatory changes directly to executive teams or boards. (Source: CUBE Cost of Compliance Report 2025)
- 83% of risk professionals say complex, interconnected risks are emerging faster than before. (Source: Accenture Risk Study 2024 Edition)
- 81% say risks from other sectors now affect their own business. (Source: Accenture Risk Study 2024 Edition)
- 77% say risks have become harder to detect and manage. (Source: Accenture Risk Study 2024 Edition)
- 72% say their risk capabilities have not kept pace with the changing environment. (Source: Accenture Risk Study 2024 Edition)
Business Value of Compliance Statistics
- 47% of C-suite respondents still describe compliance as a necessary evil that can inhibit business. (Source: NAVEX State of Risk and Compliance Report 2026)
- 40% of surveyed organizations pursue compliance certifications specifically to reach enterprise customers. (Source: Secureframe Cybersecurity and Compliance Benchmark Report 2026)
- 82% of business and IT leaders believe stronger security and compliance increase customer trust, up from 67% in 2024. (Source: Vanta State of Trust Report 2025)
- 77% say customers and other stakeholders demand verified proof of security and compliance, up from 65% in 2024. (Source: Vanta State of Trust Report 2025)
- 73% of surveyed organizations prove their security posture with a third-party audit report shared with customers or partners. (Source: Secureframe Cybersecurity and Compliance Benchmark Report 2026)
- 70% rely on security questionnaires and requests for proposals to provide assurance during sales and vendor reviews. (Source: Secureframe Cybersecurity and Compliance Benchmark Report 2026)
- 36% share internal audit reports or self-attestations with customers. (Source: Secureframe Cybersecurity and Compliance Benchmark Report 2026)
- 31% use a security dashboard or trust page to show their posture. (Source: Secureframe Cybersecurity and Compliance Benchmark Report 2026)
- 20% name demonstrating compliance to customers or partners as a leading challenge. (Source: Secureframe Cybersecurity and Compliance Benchmark Report 2026)
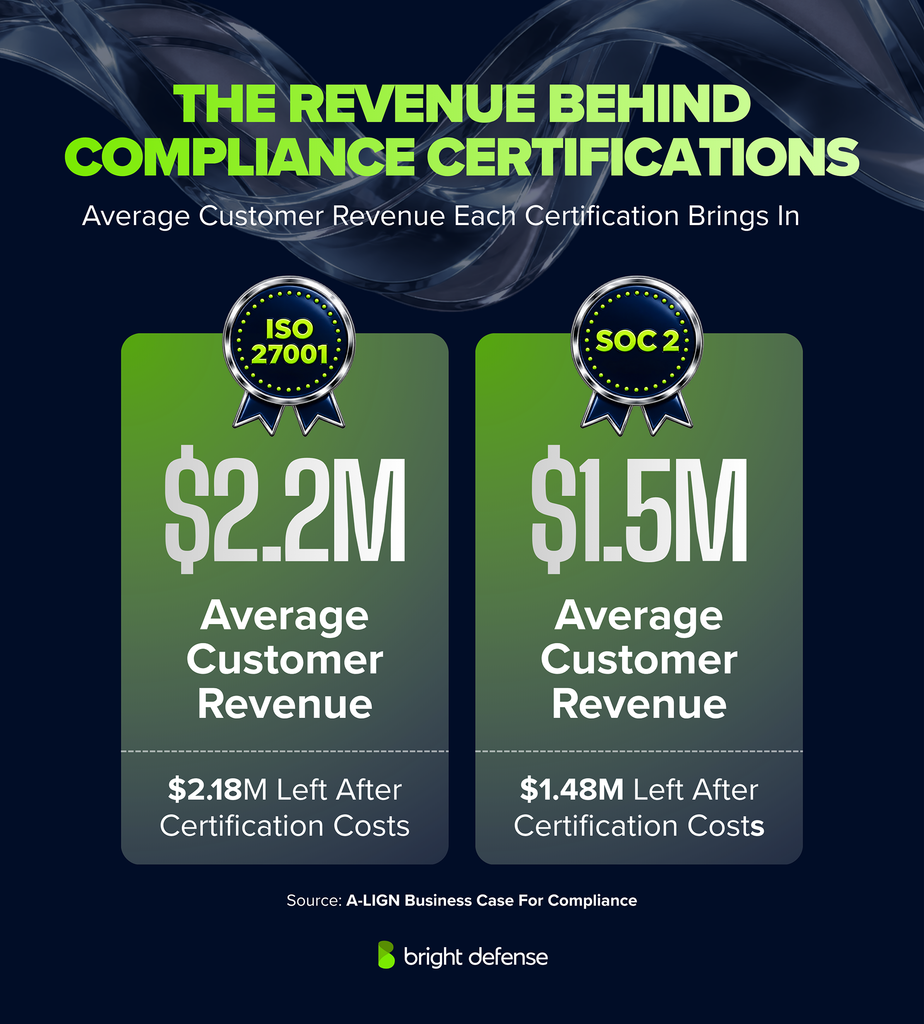
- $2.2 million is the average customer revenue unlocked through ISO 27001 in A-LIGN’s survey, with $2.18 million remaining after certification costs under its calculation. (Source: A-LIGN Business Case for Compliance 2026)
- $1.5 million is the average customer revenue unlocked through SOC 2 in A-LIGN’s survey, with $1.48 million remaining after engagement costs under its calculation. (Source: A-LIGN Business Case for Compliance 2026)
- About 50% fewer security breaches occur among organizations holding major compliance credentials in A-LIGN’s survey than among those without them. This is a survey comparison, rather than proof that obtaining a credential causes the reduction. (Source: A-LIGN Business Case for Compliance 2026)
Cost of Noncompliance Statistics
- 47% of surveyed organizations say lacking a compliance certification delayed their sales cycles. (Source: Secureframe Cybersecurity and Compliance Benchmark Report 2026)
- 24% of surveyed organizations experienced strained customer relationships because of insufficient compliance evidence. (Source: Secureframe Cybersecurity and Compliance Benchmark Report 2026)
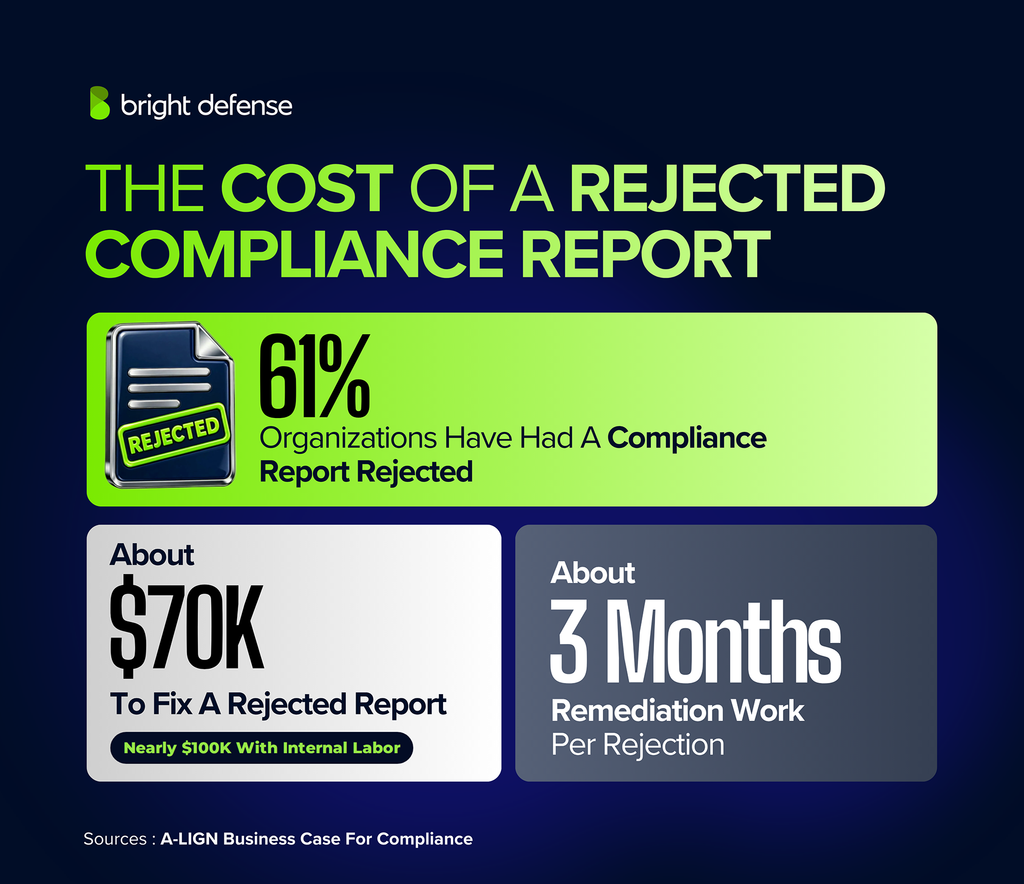
- 12% of organizations in A-LIGN’s separate survey of 500 senior information security, governance, and compliance leaders have had a compliance report rejected. (Source: A-LIGN Business Case for Compliance 2026)
- A rejected compliance report costs about $70,000 to fix, and the total approaches $100,000 once internal labor is counted. (Source: A-LIGN Business Case for Compliance 2026)
- A rejected compliance report triggers about 3 months of remediation work. (Source: A-LIGN Business Case for Compliance 2026)
- $4.99 million is the global average cost of a data breach in IBM’s 2026 study, up 12% from $4.44 million in 2025. (Source: IBM Cost of a Data Breach Report 2026)
- $10.22 million was the average cost of a U.S. data breach in IBM’s 2025 study. This is a historical comparison, not the current-year U.S. benchmark. (Source: IBM Cost of a Data Breach Report 2025)
- 241 days was the mean time to identify and contain a breach in IBM’s 2025 study, down from 258 days in 2024. (Source: IBM Cost of a Data Breach Report 2025)
- $670,000 was the additional average breach cost for organizations with high levels of shadow AI in IBM’s 2025 study. (Source: IBM Cost of a Data Breach Report 2025)
- $1.93 million is the average breach-cost saving for organizations extensively using AI and automation in security compared with those using neither in IBM’s 2026 study. (Source: IBM Cost of a Data Breach Report 2026)
- $900,000 was the average saving in IBM’s 2025 study when organizations detected a breach internally rather than learning of it from the attacker. (Source: IBM Cost of a Data Breach Report 2025)
- European supervisory authorities issued €1.2 billion in GDPR fines during 2025. (Source: DLA Piper GDPR Fines and Data Breach Survey 2026)
- 41% of surveyed organizations whose leaders tolerate greater compliance risk suffered a privacy or cybersecurity breach, compared with 25% where leaders do not. (Source: NAVEX State of Risk and Compliance Report 2026)
- 23% of surveyed organizations whose leaders tolerate greater compliance risk faced legal or regulatory action, compared with 14% where leaders do not. (Source: NAVEX State of Risk and Compliance Report 2026)
Compliance Audit Statistics
- 74% of enterprises in A-LIGN’s 1,001+ employee category conduct four or more compliance audits a year. (Source: A-LIGN Compliance Benchmark Report 2026)
- 90% of surveyed organizations work with multiple audit partners. (Source: A-LIGN Compliance Benchmark Report 2026)
- 25% name managing multiple concurrent audits as their greatest compliance challenge. (Source: A-LIGN Compliance Benchmark Report 2026)
- 20% name limited compliance staffing as the greatest challenge in their audit process. (Source: A-LIGN Compliance Benchmark Report 2026)
- 99% believe consolidating or harmonizing compliance audits could save time, money, or both. (Source: A-LIGN Compliance Benchmark Report 2026)
- 27% have not consolidated their audits because they do not know where to begin. (Source: A-LIGN Compliance Benchmark Report 2026)
- 24% have not consolidated their audits because they lack the time. (Source: A-LIGN Compliance Benchmark Report 2026)
- 80% rate the quality of a compliance report as extremely important. (Source: A-LIGN Compliance Benchmark Report 2026)
- 83% have noticed quality differences between auditors. (Source: A-LIGN Compliance Benchmark Report 2026)
- 60% would switch auditors to improve the quality of their final compliance report. (Source: A-LIGN Compliance Benchmark Report 2026)
- 95% use technology during compliance audits or assessments. (Source: A-LIGN Compliance Benchmark Report 2026)
- 96% believe audit or GRC technology produces a better audit. (Source: A-LIGN Compliance Benchmark Report 2026)
- 23% name manual internal and external audit preparation as their leading cybersecurity and compliance challenge heading into 2026. (Source: Secureframe Cybersecurity and Compliance Benchmark Report 2026)
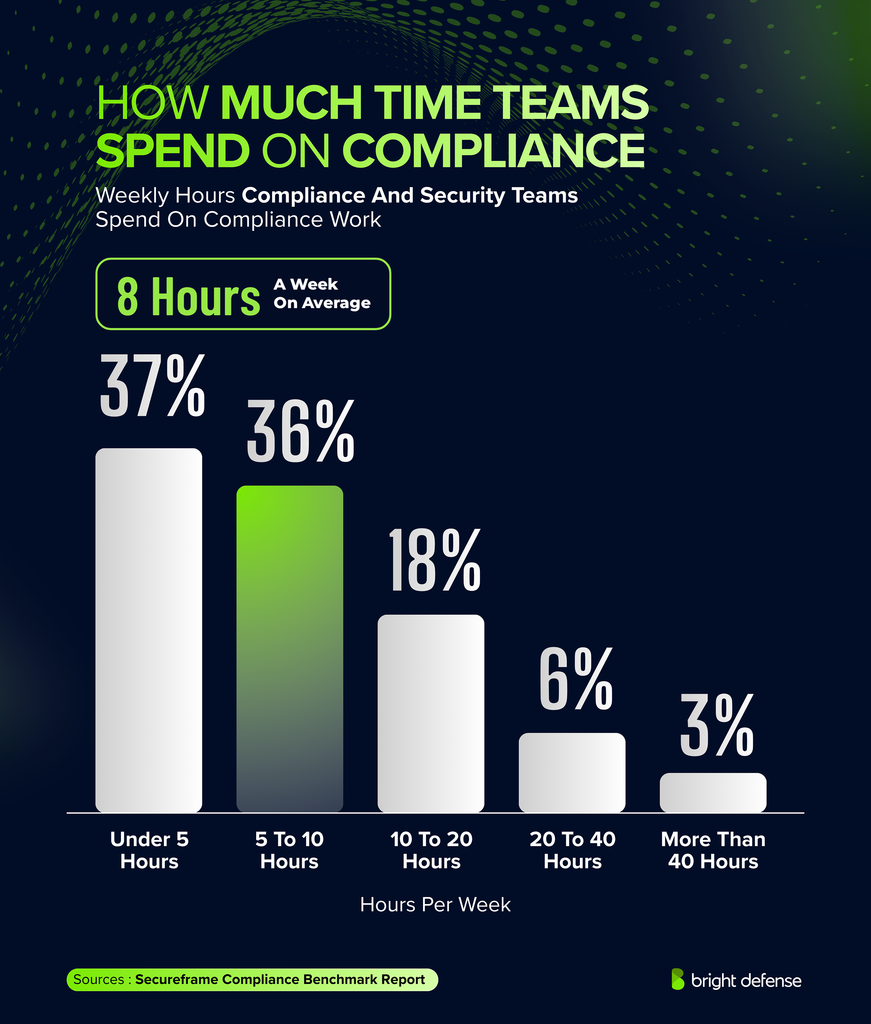
- 8 hours a week is the average time surveyed teams spend on compliance and security tasks. The following distribution shows the variation across respondents: (Source: Secureframe Cybersecurity and Compliance Benchmark Report 2026)
- Fewer than 5 hours: 36%
- 5 to 10 hours: 37%
- 10 to 20 hours: 18%
- 20 to 40 hours: 6%
- More than 40 hours: 3%
- 71% of enterprise organizations spend more than $100,000 a year on audits. (Source: A-LIGN Compliance Benchmark Report 2025)
- Budget constraints are the greatest audit challenge for 21% of small businesses, compared with 8% of enterprise organizations. (Source: A-LIGN Compliance Benchmark Report 2025)
Compliance Program Maturity Statistics
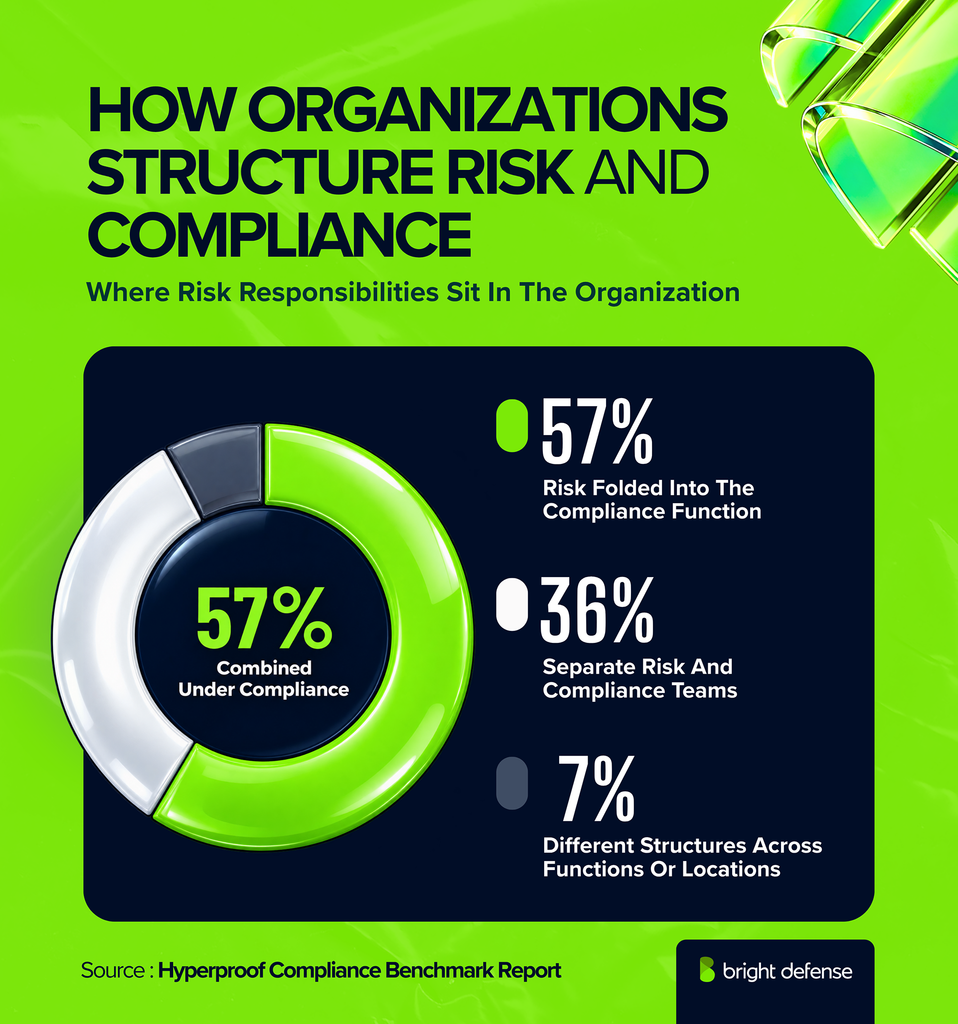
- 57% of surveyed organizations fold risk responsibilities into the compliance function. Other structures break down as follows: (Source: Hyperproof IT Risk and Compliance Benchmark Report 2026)
- Separate risk and compliance teams: 36%
- Different structures across functions or locations: 7%
- 21% of surveyed organizations with centralized GRC teams see their risk and compliance activities as fully integrated and coordinated. (Source: Hyperproof IT Risk and Compliance Benchmark Report 2026)
- 43% of centralized GRC teams run risk and compliance activities in response to separate events. (Source: Hyperproof IT Risk and Compliance Benchmark Report 2026)
- 36% of centralized GRC teams view compliance mainly as a function that enforces regulations and industry standards. (Source: Hyperproof IT Risk and Compliance Benchmark Report 2026)
- Integrated, automated programs spend 33% of team time on repetitive or administrative work, compared with 39% for ad hoc and siloed programs. (Source: Hyperproof IT Risk and Compliance Benchmark Report 2026)
- NAVEX scores compliance maturity on 5 levels: Underdeveloped, Defining, Adapting, Managing, and Optimizing. (Source: NAVEX State of Risk and Compliance Report 2026)
- 41% of Optimizing programs had no compliance issues during the previous two years, compared with 34% of Underdeveloped programs. (Source: NAVEX State of Risk and Compliance Report 2026)
- Data privacy or cybersecurity breaches hit 30% of Optimizing programs, compared with 33% of Underdeveloped programs. (Source: NAVEX State of Risk and Compliance Report 2026)
- Difficulty meeting regulatory obligations affects 15% of Optimizing programs, compared with 21% of Underdeveloped programs. (Source: NAVEX State of Risk and Compliance Report 2026)
- Third-party ethics or compliance failures affect 14% of Optimizing programs, compared with 23% of Underdeveloped programs. (Source: NAVEX State of Risk and Compliance Report 2026)
- 98% of surveyed organizations actively measure the effectiveness of their risk and compliance programs. (Source: NAVEX State of Risk and Compliance Report 2026)
- 29% of surveyed organizations use analytics tools to evaluate ethics and compliance program performance, barely changed from the prior year. (Source: LRN Ethics and Compliance Program Effectiveness Report 2026)
- High-impact programs use benchmarking tools at a rate of 58%, compared with 34% among medium-impact programs. (Source: LRN Ethics and Compliance Program Effectiveness Report 2026)
- High-impact programs outperform their peers by 1.8 times in data use and analytics tools. (Source: LRN Ethics and Compliance Program Effectiveness Report 2026)
- 53% of high-impact programs use data analytics for compliance risk detection and effectiveness measurement, up from 47% the previous year. (Source: LRN Ethics and Compliance Program Effectiveness Report 2026)
- The average global compliance program effectiveness score is 3.89 out of 5, a slight rise from 3.87 in 2025. (Source: LRN Ethics and Compliance Program Effectiveness Report 2026)
Compliance Budget Statistics
- 50% of surveyed organizations expect a slight increase in GRC spending during 2026. The rest of the outlook breaks down as follows: (Source: Hyperproof IT Risk and Compliance Benchmark Report 2026)
- Significant increase: 8%
- No change: 34%
- Reduction: 8%
- 70% of surveyed organizations run annual GRC budgets above $1 million. (Source: Hyperproof IT Risk and Compliance Benchmark Report 2026)
- 92% of surveyed organizations had the budget and resources their GRC programs needed in 2025. (Source: Hyperproof IT Risk and Compliance Benchmark Report 2026)
- Among organizations that raised GRC budgets, 45% increased spending by 11% to 25%, and 33% increased it by 1% to 10%. (Source: Hyperproof IT Risk and Compliance Benchmark Report 2026)
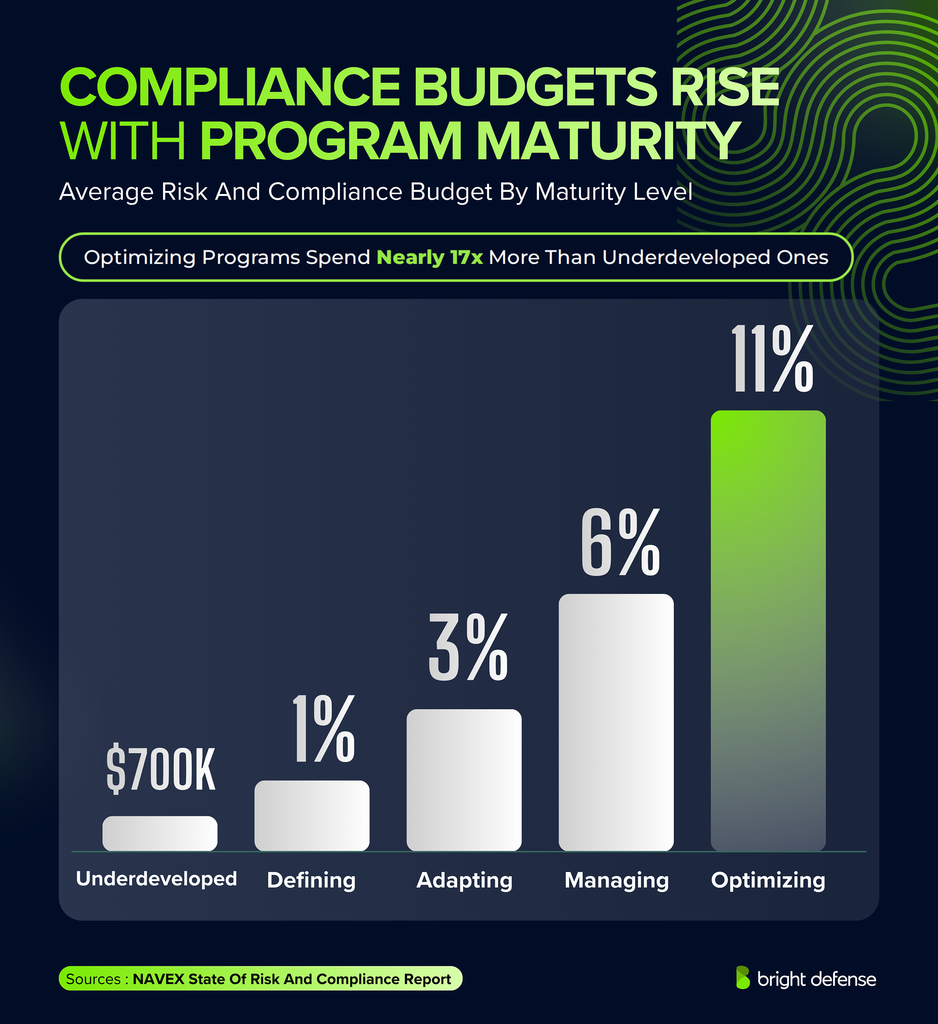
- Average risk and compliance budgets climb with program maturity, starting at $700,000 for Underdeveloped programs: (Source: NAVEX State of Risk and Compliance Report 2026)
- Defining: $1.7 million
- Adapting: $3.5 million
- Managing: $6 million
- Optimizing: $11.8 million
- 49% of surveyed organizations find internal audits the most effective argument for greater compliance investment. (Source: NAVEX State of Risk and Compliance Report 2026)
- 45% find regulatory changes the most effective argument for greater compliance investment. (Source: NAVEX State of Risk and Compliance Report 2026)
- Training and awareness receive increased investment at 53% of surveyed organizations, making it the top investment priority for 2026. Other priorities follow: (Source: NAVEX State of Risk and Compliance Report 2026)
- Technology upgrades: 49%
- Risk assessments: 45%
- Highly regulated organizations average a risk and compliance budget of $6.6 million, compared with $5.6 million in less regulated industries. (Source: NAVEX State of Risk and Compliance Report 2026)
Compliance Staffing and Workload Statistics
- 68% of surveyed organizations expect their compliance teams to grow over the next two years. (Source: Hyperproof IT Risk and Compliance Benchmark Report 2026)
- 81% of surveyed organizations with rising GRC budgets expect compliance team growth, compared with 38% of surveyed organizations with flat budgets. (Source: Hyperproof IT Risk and Compliance Benchmark Report 2026)
- 74% of technology companies expect compliance staffing growth. Expected growth by industry: (Source: Hyperproof IT Risk and Compliance Benchmark Report 2026)
- Banks: 72%
- Manufacturers: 57%
- Healthcare organizations: 45%
- 41% of risk and compliance leaders name expanded responsibilities without additional resources as their largest internal challenge. (Source: NAVEX State of Risk and Compliance Report 2026)
- 34% of compliance teams struggle to coordinate across functions. Related operating challenges: (Source: NAVEX State of Risk and Compliance Report 2026)
- Manual processes or technology limitations: 32%
- Keeping up with new regulatory demands: 31%
- Highly regulated organizations employ an average of 37 risk and compliance professionals, compared with 29 in less regulated organizations. (Source: NAVEX State of Risk and Compliance Report 2026)
- 78% of legal entity compliance functions operate with one to five dedicated full-time employees. (Source: Diligent Global State of Legal Entity Compliance 2026)
- 52% of legal entity functions operate with only one or two dedicated entity management resources. (Source: Diligent Global State of Legal Entity Compliance 2026)
- 63% of legal entity practitioners say their workload grew faster than their team or their team shrank. (Source: Diligent Global State of Legal Entity Compliance 2026)
- 52% of legal entity practitioners spend at least six hours a week tracking filings, deadlines, and record updates. (Source: Diligent Global State of Legal Entity Compliance 2026)
- 51% of legal entity practitioners had at least one near-miss in the past year, where an entity obligation almost went unmet. (Source: Diligent Global State of Legal Entity Compliance 2026)
- Resource and headcount constraints affect 43% of legal entity compliance functions. (Source: Diligent Global State of Legal Entity Compliance 2026)
- Talent retention and recruitment are a leading challenge for 27.5% of legal entity compliance practitioners. (Source: Diligent Global State of Legal Entity Compliance 2026)
- Security and compliance teams spend 9 working weeks a year on vendor security reviews and risk assessments. (Source: Vanta State of Trust Report 2025)
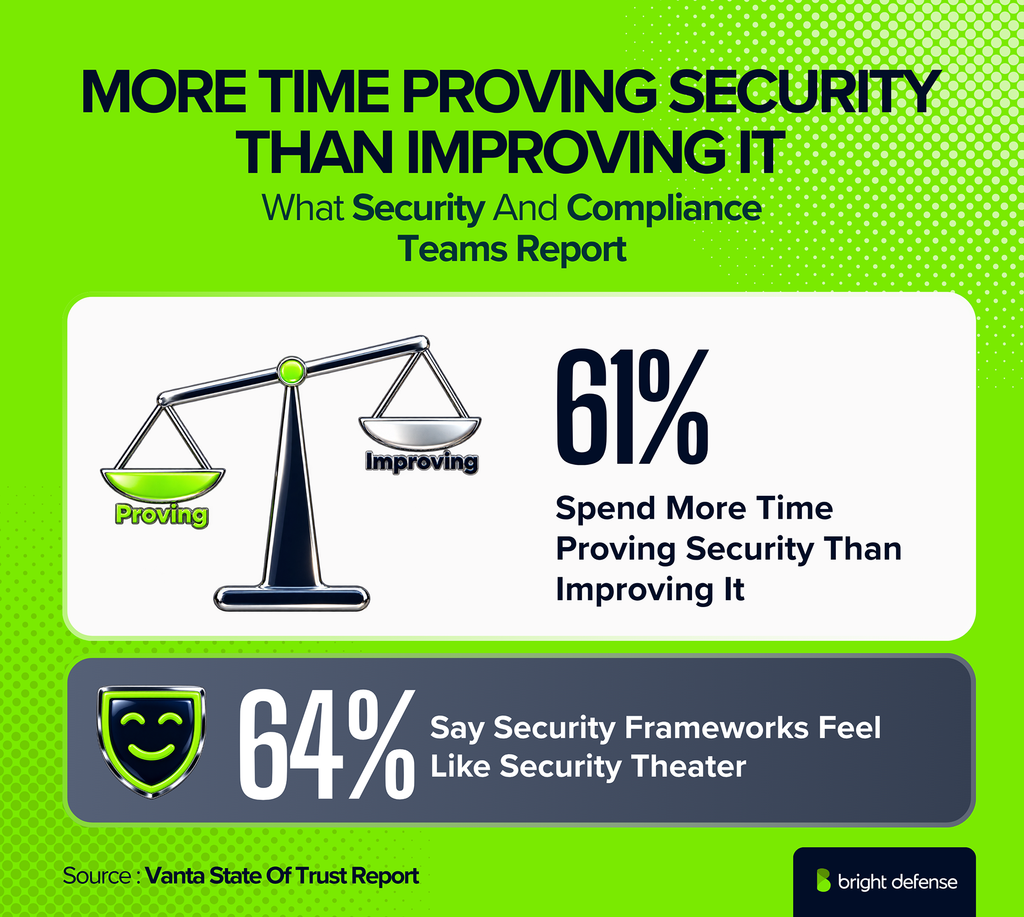
- 61% of security and compliance teams spend more time proving security than improving it. (Source: Vanta State of Trust Report 2025)
- 64% say security frameworks feel like security theater. (Source: Vanta State of Trust Report 2025)
Cybersecurity Skills Gap Statistics
- 88% of cybersecurity professionals report at least one significant organizational consequence caused by skills deficiencies. (Source: ISC2 Cybersecurity Workforce Study 2025)
- 69% of cybersecurity professionals report more than one such consequence. (Source: ISC2 Cybersecurity Workforce Study 2025)
- 63% of cybersecurity professionals report staff shortages on their teams. (Source: ISC2 Cybersecurity Workforce Study 2025)
- 34% of cybersecurity professionals believe their team has the right staffing level. (Source: ISC2 Cybersecurity Workforce Study 2025)
- 59% report at least one critical or significant cybersecurity skills need. (Source: ISC2 Cybersecurity Workforce Study 2025)
- 95% report at least one skills gap of any severity. (Source: ISC2 Cybersecurity Workforce Study 2025)
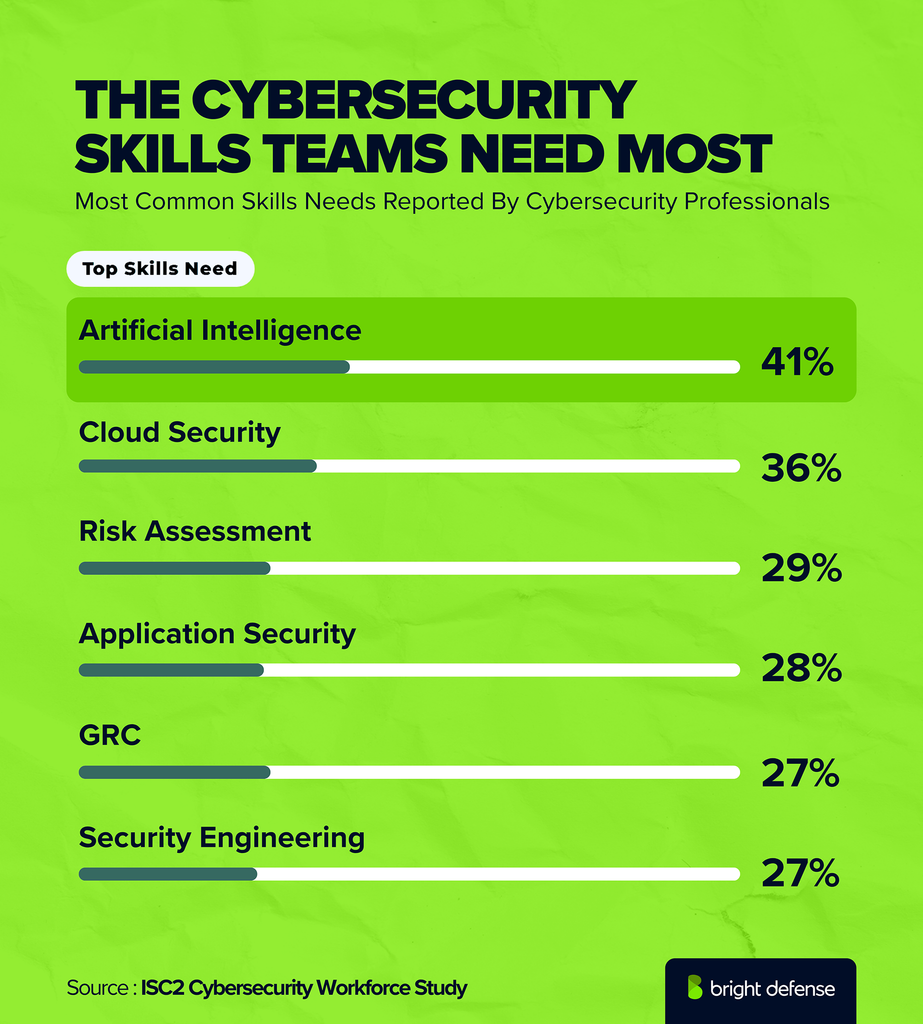
- Artificial intelligence is the most common cybersecurity skills need at 41%. Other leading needs: (Source: ISC2 Cybersecurity Workforce Study 2025)
- Cloud security: 36%
- Risk assessment: 29%
- Application security: 28%
- GRC: 27%
- Security engineering: 27%
- 33% of surveyed organizations lack the budget to staff their cybersecurity teams adequately. (Source: ISC2 Cybersecurity Workforce Study 2025)
- 29% of surveyed organizations cannot afford professionals with the skills they need. (Source: ISC2 Cybersecurity Workforce Study 2025)
- 55% believe their organizations have enough resources to respond to security incidents over the next two to three years. (Source: ISC2 Cybersecurity Workforce Study 2025)
- 70% of cybersecurity professionals hold or are pursuing AI qualifications. (Source: ISC2 Cybersecurity Workforce Study 2025)
- 72% of cybersecurity professionals say AI will require more strategic cybersecurity mindsets. (Source: ISC2 Cybersecurity Workforce Study 2025)
- 55% of ISACA respondents consider their cybersecurity teams understaffed. (Source: ISACA State of Cybersecurity 2025)
- The median security team has 8 employees. (Source: ISACA State of Cybersecurity 2025)
- 47% of surveyed organizations have open non-entry-level cybersecurity roles, compared with 18% with open entry-level roles. (Source: ISACA State of Cybersecurity 2025)
- 39% need three to six months to fill a non-entry-level cybersecurity position. (Source: ISACA State of Cybersecurity 2025)
- 25% need more than six months to fill a non-entry-level cybersecurity position. (Source: ISACA State of Cybersecurity 2025)
- Soft skills are the largest cybersecurity skills gap at 59%. Other gaps: (Source: ISACA State of Cybersecurity 2025)
- Cloud computing: 37%
- Data security: 33%
- Large language model security operations: 33%
- Scripting or automation: 30%
- 60% of employers provide professional development training to security staff. (Source: ISACA State of Cybersecurity 2025)
- 54% of employers pay employee certification fees. (Source: ISACA State of Cybersecurity 2025)
- 53% of executives rank specialist compliance, regulatory, legal, risk, or audit knowledge as an important capability. (Source: PwC Global Compliance Survey 2025)
- 43% of executives rank data management expertise as an important compliance capability. (Source: PwC Global Compliance Survey 2025)
- 86% of surveyed organizations consider the cybersecurity talent shortage a challenge, and 39% call it a significant one. (Source: Cisco Cybersecurity Readiness Index 2025)
Compliance Leadership and Board Oversight Statistics
- 54% of boards receive regular compliance updates. (Source: NAVEX State of Risk and Compliance Report 2026)
- 42% of boards provide strategic oversight of the compliance program. (Source: NAVEX State of Risk and Compliance Report 2026)
- 36% of boards take part in periodic compliance training. (Source: NAVEX State of Risk and Compliance Report 2026)
- 34% of boards have a designated committee responsible for compliance oversight. (Source: NAVEX State of Risk and Compliance Report 2026)
- 70% of respondents say senior leaders encourage compliance and ethics. The share drops further down the hierarchy: (Source: NAVEX State of Risk and Compliance Report 2026)
- Middle management: 62%
- Frontline managers: 59%
- 55% say senior leaders model proper behavior. Lower layers score as follows: (Source: NAVEX State of Risk and Compliance Report 2026)
- Middle managers: 53%
- Frontline managers: 50%
- 50% believe senior leaders stay committed to ethics when business objectives compete with compliance. Lower layers score as follows: (Source: NAVEX State of Risk and Compliance Report 2026)
- Middle management: 45%
- Frontline managers: 44%
- 29% of senior leaders tolerate greater compliance risk in pursuit of revenue or business objectives. Tolerance at other layers: (Source: NAVEX State of Risk and Compliance Report 2026)
- Middle managers: 30%
- Frontline managers: 27%
- 65% of healthcare compliance officers meet with or present to the board quarterly. (Source: SAI360 Healthcare Compliance Benchmark Report 2026)
- 23% of healthcare compliance officers routinely meet privately with the board without management present. (Source: SAI360 Healthcare Compliance Benchmark Report 2026)
Speak-Up Culture Statistics
- 61% of employees believe high performers are held to the same standards as everyone else. (Source: LRN Ethics and Compliance Program Effectiveness Report 2026)
- 58% believe managers hold themselves to the same ethical standards as other employees, a figure that falls to 15% in low-impact programs. (Source: LRN Ethics and Compliance Program Effectiveness Report 2026)
- 71% say employees keep following organizational values and the code of conduct under pressure to meet business goals. (Source: LRN Ethics and Compliance Program Effectiveness Report 2026)
- 54% say employees question decisions that appear inconsistent with organizational values or ethical standards. (Source: LRN Ethics and Compliance Program Effectiveness Report 2026)
- 88% of employees know how to ask questions or report compliance concerns. (Source: LRN Ethics and Compliance Program Effectiveness Report 2026)
- 86% of employees feel comfortable raising compliance concerns. (Source: LRN Ethics and Compliance Program Effectiveness Report 2026)
- 85% believe their organization encourages reporting and protects people who raise concerns from retaliation. (Source: LRN Ethics and Compliance Program Effectiveness Report 2026)
- 78% say supervisors or managers regularly discuss compliance and ethical issues. (Source: LRN Ethics and Compliance Program Effectiveness Report 2026)
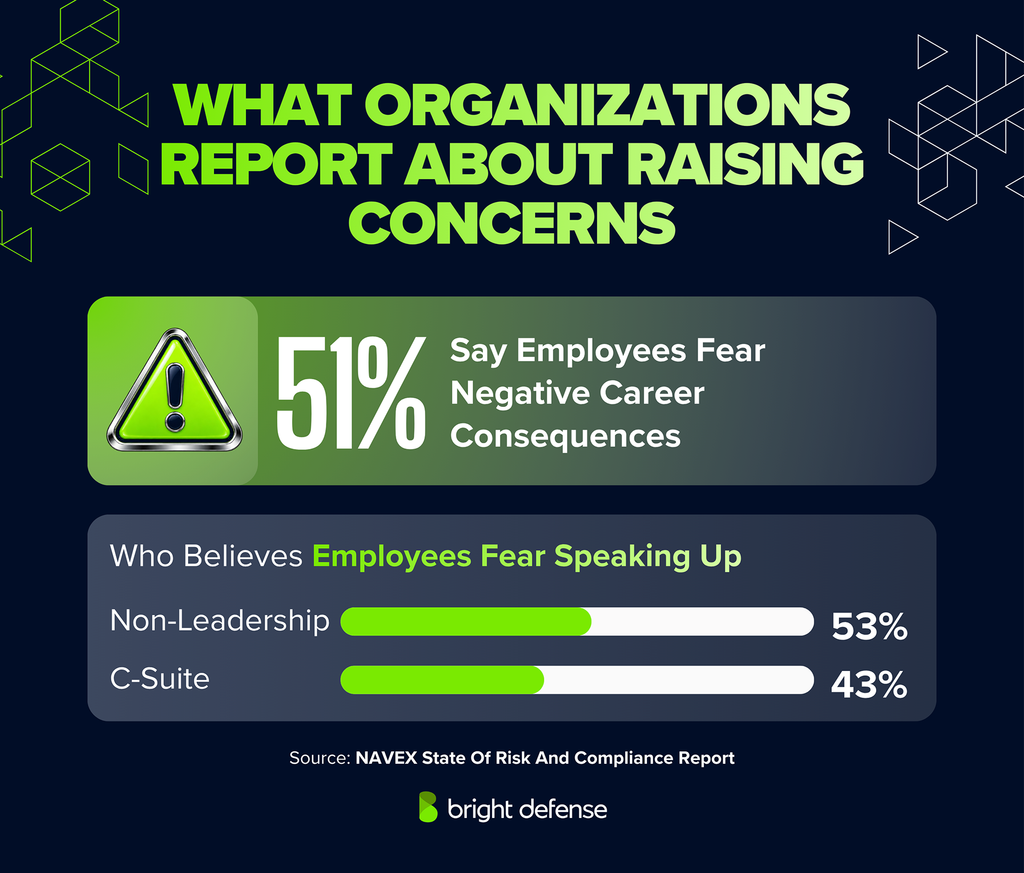
- 51% of surveyed organizations say leaders encourage employees to speak up, and the same share say employees fear negative career consequences for doing so. (Source: NAVEX State of Risk and Compliance Report 2026)
- 53% of non-leadership respondents believe employees fear consequences for speaking up, compared with 43% of C-suite respondents. (Source: NAVEX State of Risk and Compliance Report 2026)
- 47% of surveyed organizations offer no anonymous option among their reporting channels. (Source: NAVEX State of Risk and Compliance Report 2026)
- 18% of surveyed organizations cite fear of retaliation as a reporting deterrent. (Source: NAVEX State of Risk and Compliance Report 2026)
Compliance Training Statistics
- 84% of employees say compliance training is relevant to their role and suited to their needs. (Source: LRN Ethics and Compliance Program Effectiveness Report 2026)
- 77% of employees consider their compliance training engaging. (Source: LRN Ethics and Compliance Program Effectiveness Report 2026)
- 85% of employees know where to find compliance guidance. (Source: LRN Ethics and Compliance Program Effectiveness Report 2026)
- 87% of employees consider the available policies and guidance relevant and helpful. (Source: LRN Ethics and Compliance Program Effectiveness Report 2026)
- 92% of surveyed Nordic organizations provide Code of Conduct training to all employees. (Source: Nordic Ethics and Compliance Survey 2025)
- 64% of Nordic organizations provide risk-based ethics and compliance training built for specific employee roles. (Source: Nordic Ethics and Compliance Survey 2025)
- 75% of healthcare organizations provide compliance training at hire and annually after that. (Source: SAI360 Healthcare Compliance Benchmark Report 2026)
- Nearly 50% of healthcare organizations evaluate whether compliance training works beyond tracking attendance. (Source: SAI360 Healthcare Compliance Benchmark Report 2026)
- 50% of healthcare organizations provide specialized training matched to employees’ individual responsibilities. (Source: SAI360 Healthcare Compliance Benchmark Report 2026)
- 76% of surveyed organizations have formal compliance training plans, up from 69% a year earlier. (Source: NAVEX State of Risk and Compliance Report 2025)
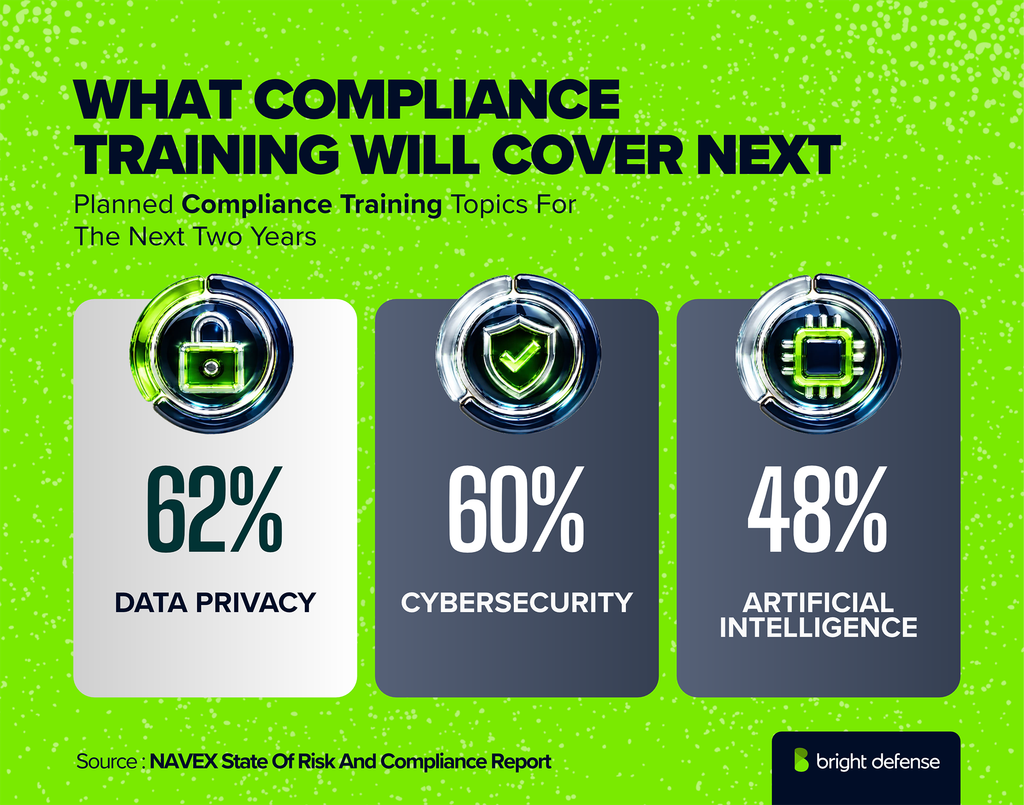
- Data privacy leads planned compliance training topics for the next two years at 62%. Other planned topics: (Source: NAVEX State of Risk and Compliance Report 2025)
- Cybersecurity: 60%
- Artificial intelligence: 48%
- 48% of business leaders believe their employees understand how attackers use AI to improve attacks. (Source: Cisco Cybersecurity Readiness Index 2025)
Compliance Automation Statistics
- 49% of surveyed organizations use technology across at least 11 compliance activities. (Source: PwC Global Compliance Survey 2025)
- 82% plan to increase investment in at least one technology that automates or improves compliance activities. (Source: PwC Global Compliance Survey 2025)
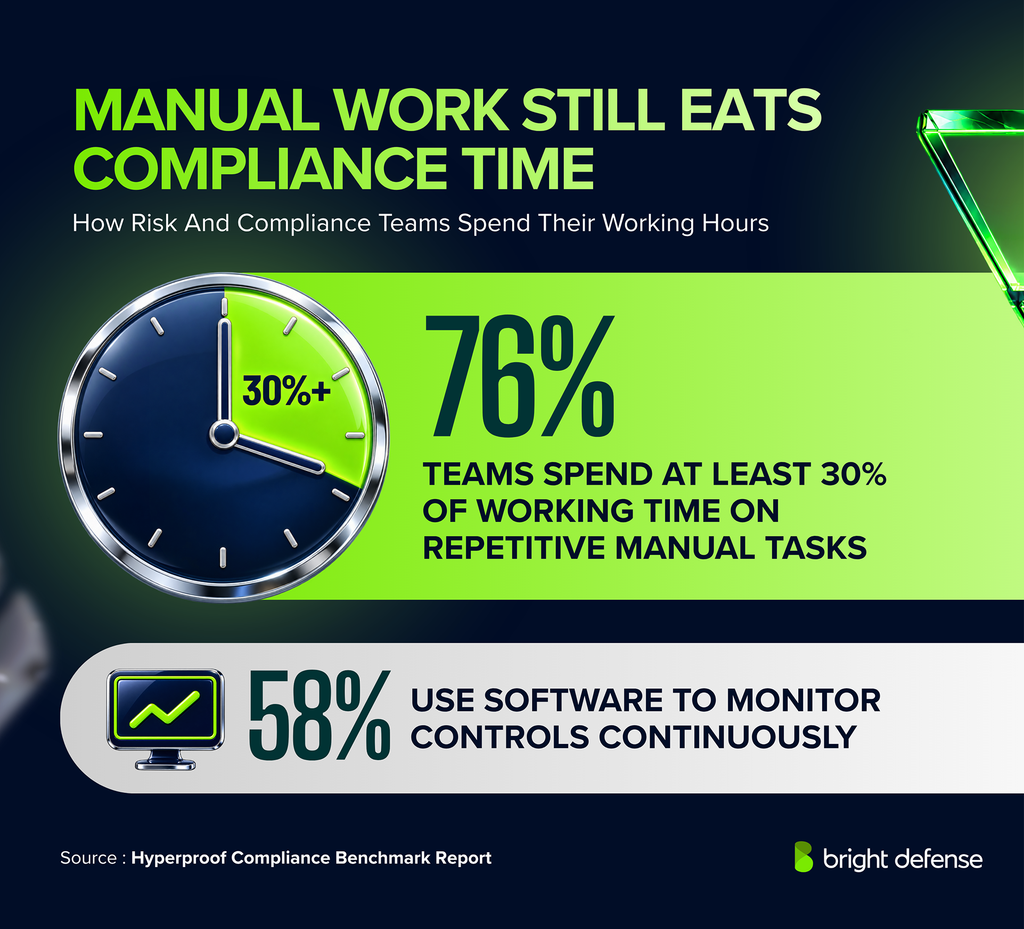
- 58% of surveyed organizations use software to monitor controls continuously. (Source: Hyperproof IT Risk and Compliance Benchmark Report 2026)
- 76% of risk and compliance teams spend at least 30% of their working time on repetitive manual and administrative tasks. (Source: Hyperproof IT Risk and Compliance Benchmark Report 2026)
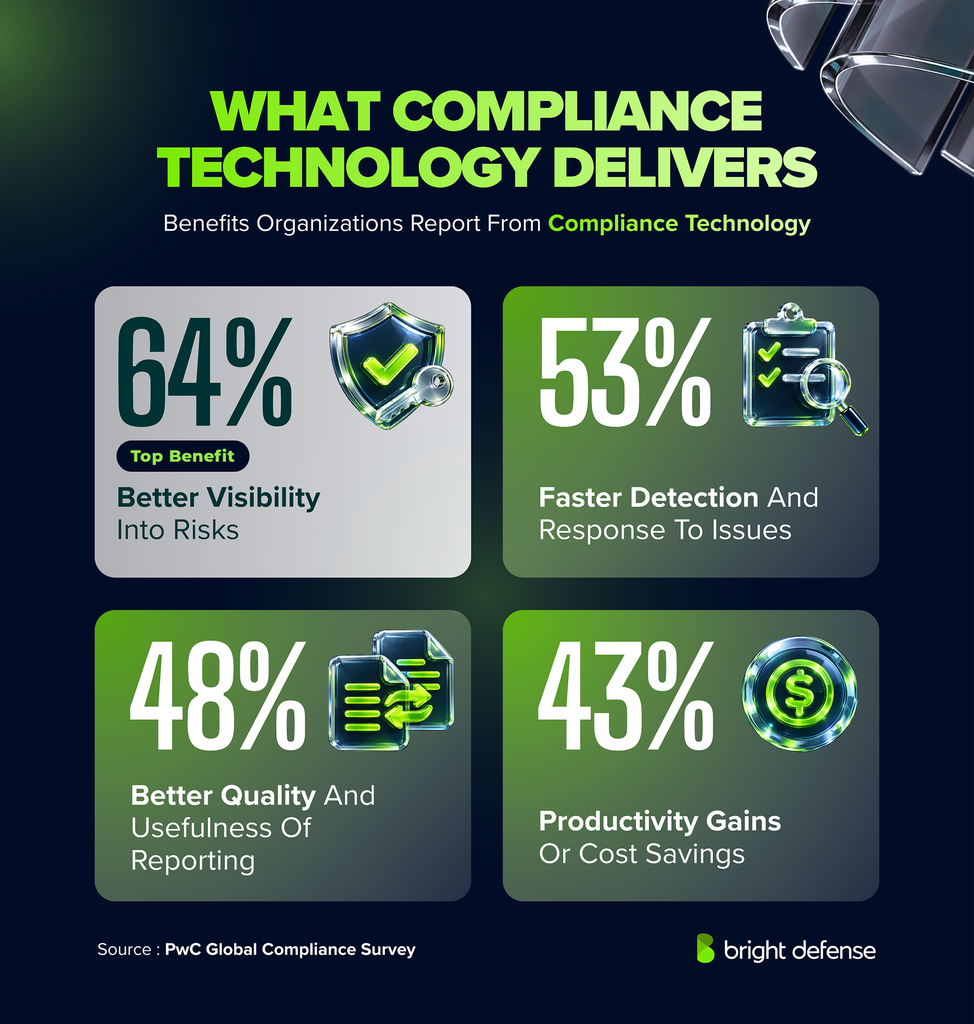
- Compliance technology gives 64% of surveyed organizations better visibility into risks. Other benefits: (Source: PwC Global Compliance Survey 2025)
- Faster detection of and response to compliance issues: 53%
- Better quality and usefulness of reporting: 48%
- Productivity gains or cost savings: 43%
- Training is the most common use of compliance technology at 82%. Other leading uses: (Source: PwC Global Compliance Survey 2025)
- Risk assessment: 76%
- Compliance and transaction monitoring: 75%
- 15% of surveyed organizations struggle to monitor systems and controls continuously. (Source: Secureframe Cybersecurity and Compliance Benchmark Report 2026)
AI in Compliance Statistics
- 97% of GRC professionals use AI to speed up at least part of their workflows. (Source: Hyperproof IT Risk and Compliance Benchmark Report 2026)
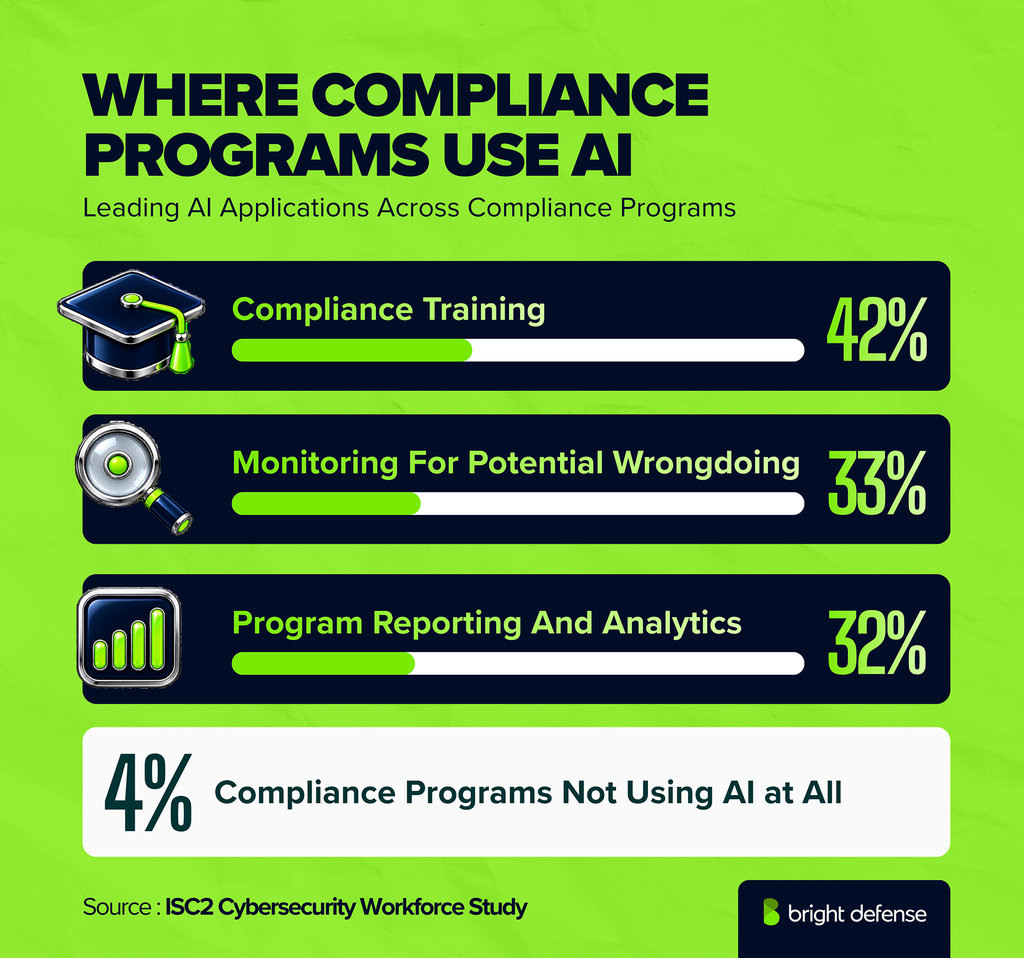
- 4% of compliance programs use AI in no area at all. (Source: NAVEX State of Risk and Compliance Report 2026)
- Compliance training is the most common AI application at 42% of programs. Other leading uses: (Source: NAVEX State of Risk and Compliance Report 2026)
- Monitoring and surveillance of potential wrongdoing: 33%
- Program reporting and analytics: 32%
- 39% of surveyed organizations use AI in their compliance training. (Source: LRN Ethics and Compliance Program Effectiveness Report 2026)
- High-impact programs are 2.2 times more likely to focus on AI risks than other programs. Related differences: (Source: LRN Ethics and Compliance Program Effectiveness Report 2026)
- Integrating AI into training: 1.4 times more likely
- Addressing AI in codes of conduct: 1.3 times more likely
- 69% of legal entity compliance functions use embedded productivity AI tools such as Microsoft Copilot, Google Workspace AI, and Glean. (Source: Diligent Global State of Legal Entity Compliance 2026)
- 71% of executives expect AI to have a net positive impact on compliance. (Source: PwC Global Compliance Survey 2025)
- 46% of surveyed companies are piloting AI in compliance data analytics. (Source: PwC Global Compliance Survey 2025)
- 36% of surveyed companies are piloting AI for fraud detection. (Source: PwC Global Compliance Survey 2025)
- 65% of surveyed organizations consider AI important to their compliance strategy, and 25% consider it critical. (Source: NAVEX State of Risk and Compliance Report 2026)
- 94% of respondents expect AI to be the most significant driver of cybersecurity change over the next year. (Source: World Economic Forum Global Cybersecurity Outlook 2026)
AI Governance Statistics
- 79% of surveyed organizations use or actively plan to use agentic AI. (Source: Vanta State of Trust Report 2025)
- 65% say their use of agentic AI has outpaced their understanding of the technology. (Source: Vanta State of Trust Report 2025)
- 48% have a framework for granting or limiting autonomy in agentic AI systems. (Source: Vanta State of Trust Report 2025)
- 62% worry that agentic AI could erode customer trust. (Source: Vanta State of Trust Report 2025)
- 45% conduct regular AI risk assessments and audits. (Source: Vanta State of Trust Report 2025)
- 44% have created and implemented a company AI policy. (Source: Vanta State of Trust Report 2025)
- 41% apply strict data minimization practices to AI use. (Source: Vanta State of Trust Report 2025)
- 35% rely exclusively on anonymized data when training AI systems. (Source: Vanta State of Trust Report 2025)
- 31% of surveyed organizations that train AI on customer data require customers to opt in. (Source: Vanta State of Trust Report 2025)
- 72% of surveyed organizations are concerned about AI’s impact on compliance. (Source: A-LIGN Compliance Benchmark Report 2026)
- 33% of surveyed organizations have no AI compliance strategy in place. (Source: A-LIGN Compliance Benchmark Report 2026)
- 80% of surveyed companies that use AI already field customer questions about their AI risk management practices. (Source: A-LIGN Compliance Benchmark Report 2026)
- 47% of surveyed organizations expect the EU AI Act to affect them this year. (Source: A-LIGN Compliance Benchmark Report 2026)
- 29% of surveyed organizations have no process for assessing the security of AI tools before deployment. (Source: World Economic Forum Global Cybersecurity Outlook 2026)
- 45% of business leaders say their company has the internal resources and expertise to run AI security assessments. (Source: Cisco Cybersecurity Readiness Index 2025)
- 64% of legal entity compliance practitioners rank AI governance and oversight as the most important capability for the next three years. (Source: Diligent Global State of Legal Entity Compliance 2026)
- 31% of legal entity compliance functions have formally added AI governance to their responsibilities. (Source: Diligent Global State of Legal Entity Compliance 2026)
- 38% of legal entity practitioners are comfortable letting AI complete basic compliance actions without prior human approval. (Source: Diligent Global State of Legal Entity Compliance 2026)
- 33% of ethics and compliance programs address AI ethics in their codes of conduct. (Source: LRN Ethics and Compliance Program Effectiveness Report 2026)
Cybersecurity Readiness Statistics
- 70% of surveyed organizations remain in the Formative or Beginner stages of cybersecurity readiness. (Source: Cisco Cybersecurity Readiness Index 2025)
- 49% of surveyed organizations experienced at least one cyberattack in the past year. (Source: Cisco Cybersecurity Readiness Index 2025)
- 71% expect a cybersecurity incident to disrupt their business within the next 12 to 24 months. (Source: Cisco Cybersecurity Readiness Index 2025)
- 34% are highly confident their current infrastructure can withstand an attack. (Source: Cisco Cybersecurity Readiness Index 2025)
- 77% say too many disconnected security products slow their ability to detect, respond to, and recover from incidents. (Source: Cisco Cybersecurity Readiness Index 2025)
- 84% say employees access company networks from unmanaged devices. (Source: Cisco Cybersecurity Readiness Index 2025)
- 86% of business leaders with cybersecurity responsibilities had at least one AI-related security incident in the past 12 months. (Source: Cisco Cybersecurity Readiness Index 2025)
- The global median attacker dwell time is 14 days, up from 11 days the year before. (Source: Mandiant M-Trends Report 2026)
- Exploited vulnerabilities cause 32% of incidents where the initial infection vector is known. (Source: Mandiant M-Trends Report 2026)
- Ransomware intrusions have a median dwell time of 9 days. The figure shifts with how the intrusion surfaces: (Source: Mandiant M-Trends Report 2026)
- Disclosed by the attacker: 5 days
- Detected internally: 12 days
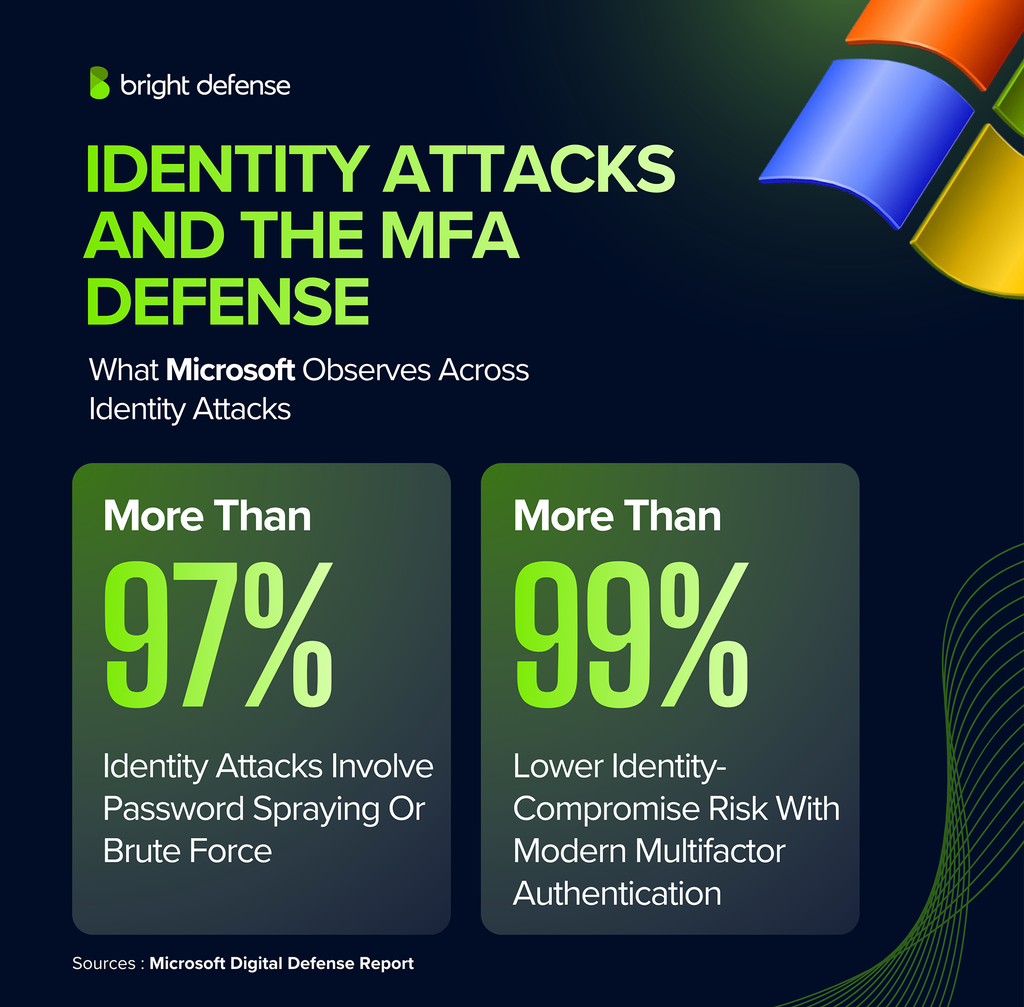
- More than 97% of identity attacks Microsoft observes involve password spraying or brute-force techniques. (Source: Microsoft Digital Defense Report 2025)
- Modern multifactor authentication cuts identity-compromise risk by more than 99%. (Source: Microsoft Digital Defense Report 2025)
- 28.96% of known exploited vulnerabilities in 2025 were exploited on or before the day their CVE was published. (Source: VulnCheck State of Exploitation 2026)
- 87% of respondents name AI-related vulnerabilities as the fastest-growing cyber risk. (Source: World Economic Forum Global Cybersecurity Outlook 2026)
- 77% of respondents say cyber-enabled fraud and phishing increased over the past year. (Source: World Economic Forum Global Cybersecurity Outlook 2026)
- 90% of surveyed organizations lack the security maturity to counter modern AI-driven threats. (Source: Accenture State of Cybersecurity Resilience 2025)
- 10% of surveyed organizations sit in Accenture’s Reinvention-Ready Zone for security maturity. (Source: Accenture State of Cybersecurity Resilience 2025)
- 77% of surveyed organizations lack foundational data and AI security practices for critical models, data pipelines, and cloud infrastructure. (Source: Accenture State of Cybersecurity Resilience 2025)
- 20% of surveyed organizations are confident they can secure generative AI models against cyber risk. (Source: Accenture State of Cybersecurity Resilience 2025)
Data Privacy Statistics
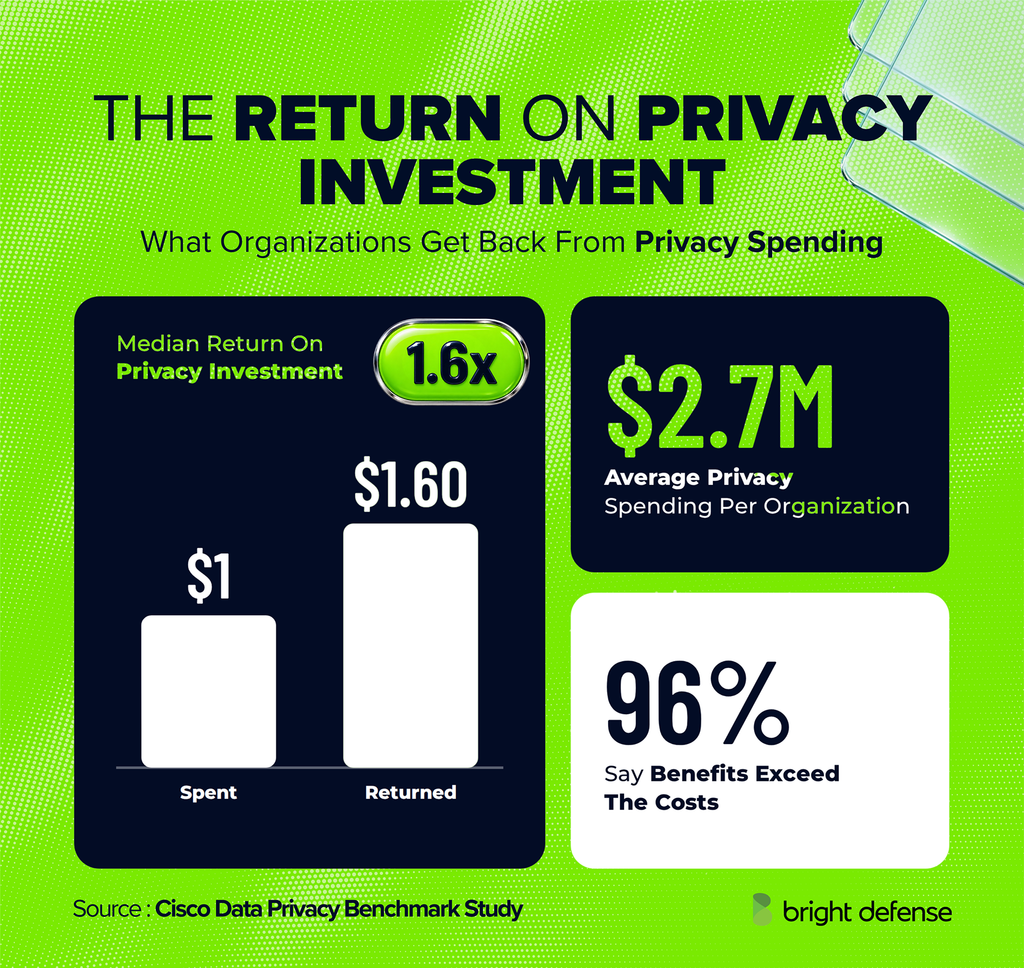
The following survey findings describe privacy spending, perceived returns, and customer expectations. Investment returns are respondents’ assessments rather than guaranteed financial results.
- 99% of organizations receive at least one tangible benefit from privacy initiatives, including agility, innovation, and customer loyalty. (Source: Cisco Data and Privacy Benchmark Study 2026)
- 96% say the benefits of privacy investment exceed its costs. (Source: Cisco Data Privacy Benchmark Study 2025)
- Average organizational privacy spending reaches $2.7 million. (Source: Cisco Data Privacy Benchmark Study 2025)
- 53% estimate their privacy spending returns between one and two times the investment. (Source: Cisco Data Privacy Benchmark Study 2025)
- The median return on privacy investment is 1.6 times the amount spent. (Source: Cisco Data Privacy Benchmark Study 2025)
- 79% of organizations gain significant customer loyalty and trust benefits from privacy investment. (Source: Cisco Data Privacy Benchmark Study 2025)
- 76% say privacy investments reduce security losses. (Source: Cisco Data Privacy Benchmark Study 2025)
- 75% say privacy investments reduce sales delays. (Source: Cisco Data Privacy Benchmark Study 2025)
- 86% say privacy legislation has a positive effect on their organization. (Source: Cisco Data Privacy Benchmark Study 2025)
- 99% consider external privacy certifications important when selecting vendors. (Source: Cisco Data Privacy Benchmark Study 2025)
- 95% believe customers will not buy from organizations that fail to protect their data properly. (Source: Cisco Data Privacy Benchmark Study 2025)
- 90% of security and privacy professionals believe data is inherently safer when stored within their own country or region. (Source: Cisco Data Privacy Benchmark Study 2025)
- 91% believe global providers protect data better than providers operating in a single country or region. (Source: Cisco Data Privacy Benchmark Study 2025)
- 88% say data localization adds significant operational costs. (Source: Cisco Data Privacy Benchmark Study 2025)
DORA Readiness Statistics
- 83% of European financial entities have estimated their DORA compliance costs. (Source: Deloitte European DORA Survey 2025)
- 64% expect DORA compliance to cost between €2 million and €5 million. (Source: Deloitte European DORA Survey 2025)
- 8% expect DORA compliance to cost between €5 million and €10 million. (Source: Deloitte European DORA Survey 2025)
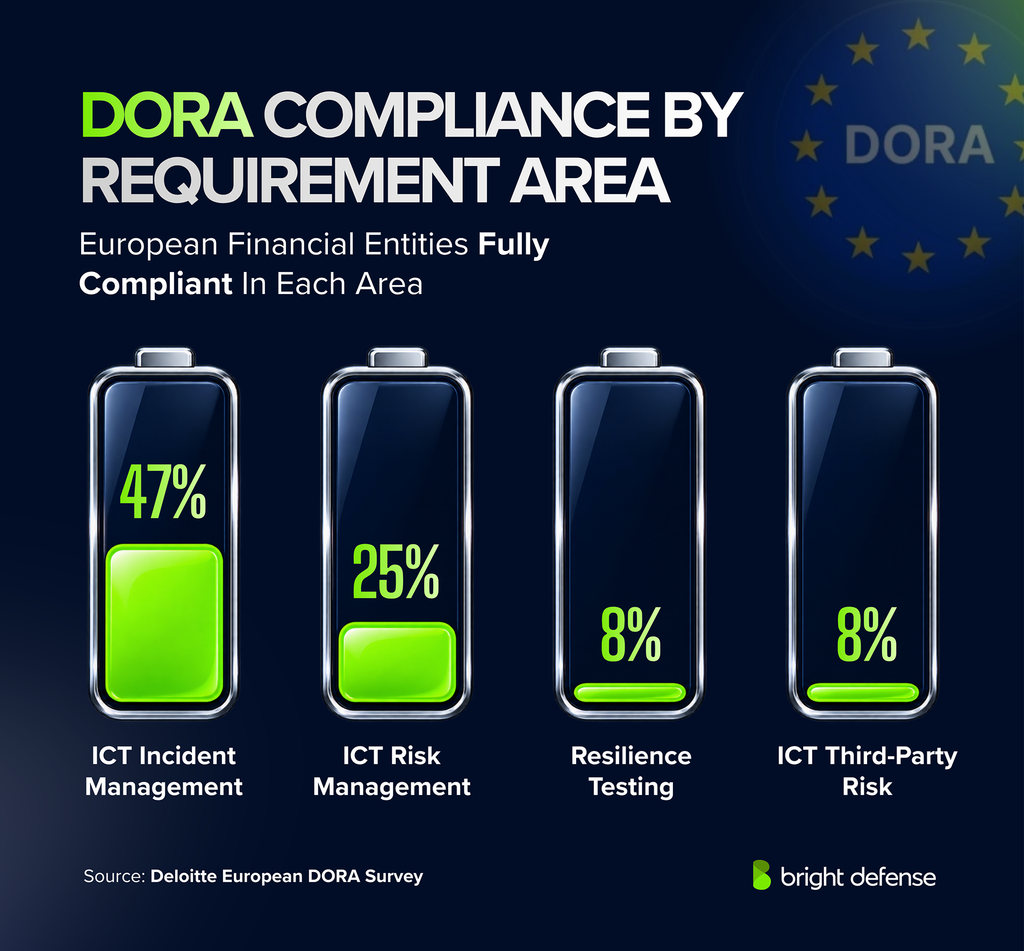
- 48% are fully compliant with DORA’s ICT incident management, classification, and reporting requirements. (Source: Deloitte European DORA Survey 2025)
- 25% are fully compliant with DORA’s ICT risk management requirements. (Source: Deloitte European DORA Survey 2025)
- 8% are fully compliant with digital operational resilience testing, and the same share are fully compliant with ICT third-party risk management. (Source: Deloitte European DORA Survey 2025)
- 46% name completing the DORA Register of Information as their most difficult implementation requirement. (Source: Deloitte European DORA Survey 2025)
- 42% name ICT network segregation and segmentation as their most difficult network security requirement. (Source: Deloitte European DORA Survey 2025)
- 42% always record the costs and losses caused by ICT incidents and disruptions. (Source: Deloitte European DORA Survey 2025)
- 37% record ICT incident costs and losses only sometimes. (Source: Deloitte European DORA Survey 2025)
- 54% leave third-party ICT providers out of the validation of their incident response plans. (Source: Deloitte European DORA Survey 2025)
- 25% train ICT providers on their response responsibilities and include them in crisis simulations. (Source: Deloitte European DORA Survey 2025)
- 38% of financial entities are still mapping their ICT service supply chains. Mapping depth for the rest: (Source: Deloitte European DORA Survey 2025)
- Direct providers only: 32%
- Through the second tier: 29%
- Beyond the second tier: 1%
Third-Party Risk Statistics
- 70% of surveyed organizations experienced a data breach over the past three years. (Source: Whistic Third-Party Risk Management Impact Report 2025)
- 56% of surveyed organizations had a vendor suffer a breach recently. (Source: Vanta State of Trust Report 2025)
- 56% of surveyed companies work with more than 100 vendors. (Source: Whistic Third-Party Risk Management Impact Report 2025)
- The average company works with 286 vendors across software, infrastructure, professional services, and business-critical technology. (Source: Whistic Third-Party Risk Management Impact Report 2025)
- Organizations expect to assess an average of 255 vendors during the year. (Source: Whistic Third-Party Risk Management Impact Report 2025)
- The average third-party risk management (TPRM) team has 8.5 people. (Source: Whistic Third-Party Risk Management Impact Report 2025)
- 75% of surveyed organizations operate with fewer than 10 TPRM employees. (Source: Whistic Third-Party Risk Management Impact Report 2025)
- 80% plan to hire more staff for vendor assessments within 12 months. (Source: Whistic Third-Party Risk Management Impact Report 2025)
- 94% would assess more vendors with better processes, staffing, technology, or resources. (Source: Whistic Third-Party Risk Management Impact Report 2025)
- 97% would run more detailed vendor assessments with better processes, staffing, technology, or resources. (Source: Whistic Third-Party Risk Management Impact Report 2025)
- 58% of surveyed organizations spend more than 30 hours a week on vendor assessments. (Source: Whistic Third-Party Risk Management Impact Report 2025)
- The average TPRM team spends 37.4 hours a week on vendor assessments. (Source: Whistic Third-Party Risk Management Impact Report 2025)
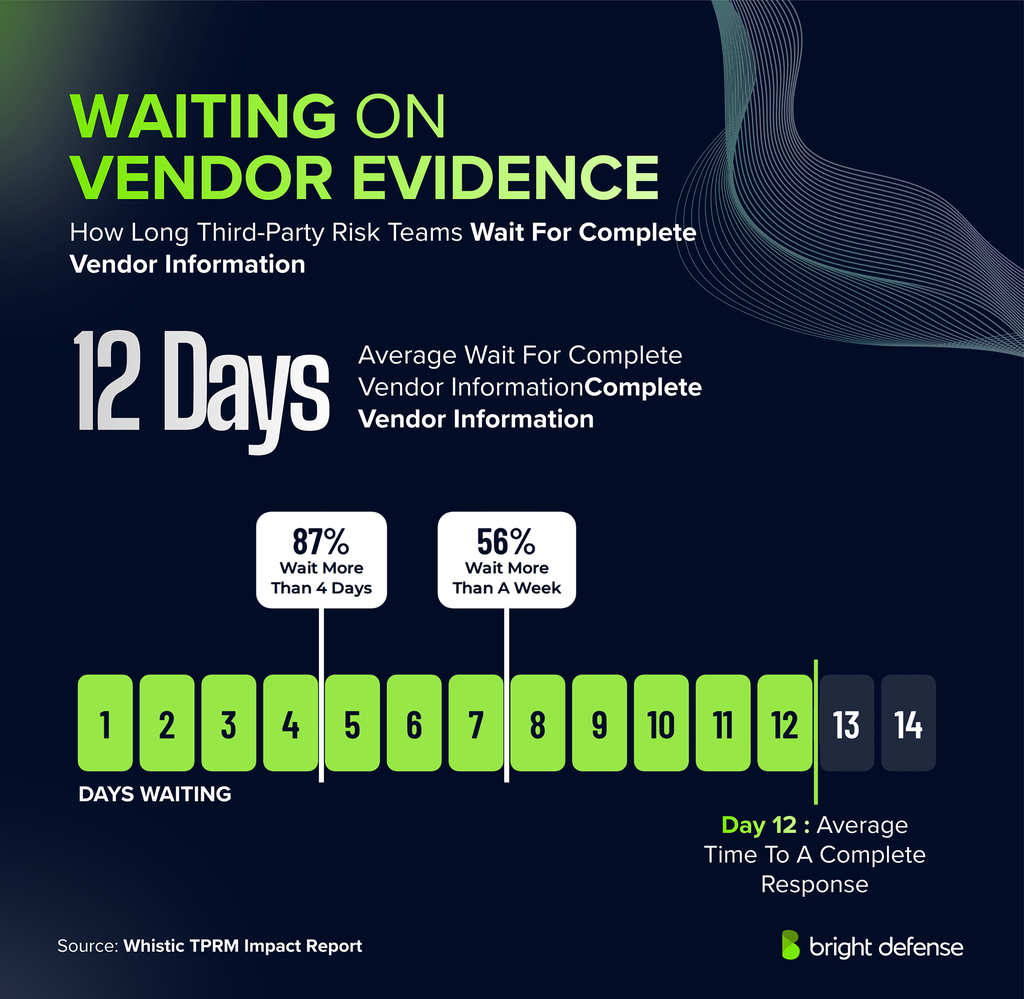
- 87% wait more than four days for complete vendor information. Longer waits break down as follows: (Source: Whistic Third-Party Risk Management Impact Report 2025)
- More than one week: 56%
- Average wait for a complete response: 12 days
- 84% of initial vendor assessments require more evidence, clarification, remediation, or another follow-up. (Source: Whistic Third-Party Risk Management Impact Report 2025)
- 88% almost always or always search vendor documentation by hand for specific evidence, control gaps, or data points. (Source: Whistic Third-Party Risk Management Impact Report 2025)
- The average organization faces 7 security events a year that trigger vendor outreach or reassessment. (Source: Whistic Third-Party Risk Management Impact Report 2025)
- Each vendor-related security event requires 14.8 hours of follow-up. (Source: Whistic Third-Party Risk Management Impact Report 2025)
- 75% use customized security questionnaires during vendor assessments. (Source: Whistic Third-Party Risk Management Impact Report 2025)
- 74% accept a completed standard assessment such as SIG, ISO, or CAIQ. (Source: Whistic Third-Party Risk Management Impact Report 2025)
- 93% would at least begin an assessment with a completed standard questionnaire. (Source: Whistic Third-Party Risk Management Impact Report 2025)
- A complete security questionnaire takes a vendor an average of 4.8 hours. (Source: Whistic Third-Party Risk Management Impact Report 2025)
- Questionnaires consume 179 hours of vendor employee time per month. (Source: Whistic Third-Party Risk Management Impact Report 2025)
- 76% of vendors run a customer-facing trust center. (Source: Whistic Third-Party Risk Management Impact Report 2025)
- 34% of trust center users deflect more than half of incoming questionnaires. (Source: Whistic Third-Party Risk Management Impact Report 2025)
- 34% of surveyed organizations still manage third-party risk in spreadsheets. (Source: Hyperproof IT Risk and Compliance Benchmark Report 2026)
- 73% of integrated, automated programs use dedicated vendor risk software, compared with 49% of integrated but mostly manual programs. (Source: Hyperproof IT Risk and Compliance Benchmark Report 2026)
SaaS and Supply Chain Security Statistics
- 86% of surveyed organizations rank SaaS security as a high or highest priority. (Source: Cloud Security Alliance State of SaaS Security Report 2025)
- 76% of surveyed organizations were increasing SaaS security budgets in 2025. (Source: Cloud Security Alliance State of SaaS Security Report 2025)
- 63% name external oversharing of sensitive or confidential SaaS data as a significant security risk. (Source: Cloud Security Alliance State of SaaS Security Report 2025)
- 57% report fragmented SaaS administration across their organization. (Source: Cloud Security Alliance State of SaaS Security Report 2025)
- 56% say employees upload sensitive data to unauthorized SaaS applications. (Source: Cloud Security Alliance State of SaaS Security Report 2025)
- 55% say employees adopt SaaS tools without security team involvement. (Source: Cloud Security Alliance State of SaaS Security Report 2025)
- 56% worry that third-party vendors and AI-powered SaaS tools hold overprivileged API access to organizational data. (Source: Cloud Security Alliance State of SaaS Security Report 2025)
- 46% struggle to monitor non-human identities such as OAuth tokens, APIs, and service accounts. (Source: Cloud Security Alliance State of SaaS Security Report 2025)
- 54% lack automated user provisioning and deprovisioning across SaaS environments. (Source: Cloud Security Alliance State of SaaS Security Report 2025)
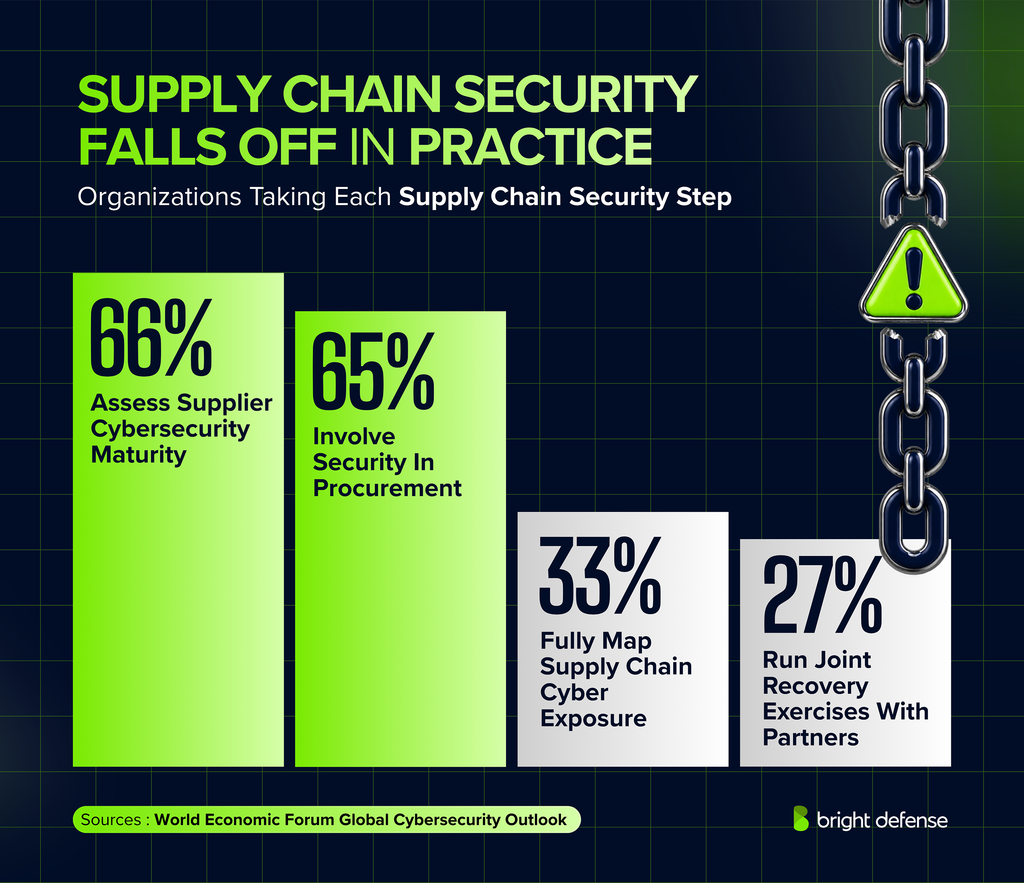
- 66% of surveyed organizations assess supplier cybersecurity maturity. (Source: World Economic Forum Global Cybersecurity Outlook 2026)
- 65% involve cybersecurity teams in procurement or supplier selection. (Source: World Economic Forum Global Cybersecurity Outlook 2026)
- 33% fully map their supply chain cyber exposure. (Source: World Economic Forum Global Cybersecurity Outlook 2026)
- 27% run joint incident or recovery exercises with ecosystem partners. (Source: World Economic Forum Global Cybersecurity Outlook 2026)
Compliance Framework Adoption Statistics
- 46% of surveyed organizations have one compliance framework achieved or in progress. The remaining framework-count categories are as follows: (Source: Secureframe Cybersecurity and Compliance Benchmark Report 2026)
- Two frameworks: 31%
- Three frameworks: 17%
- Four or more frameworks: 4%
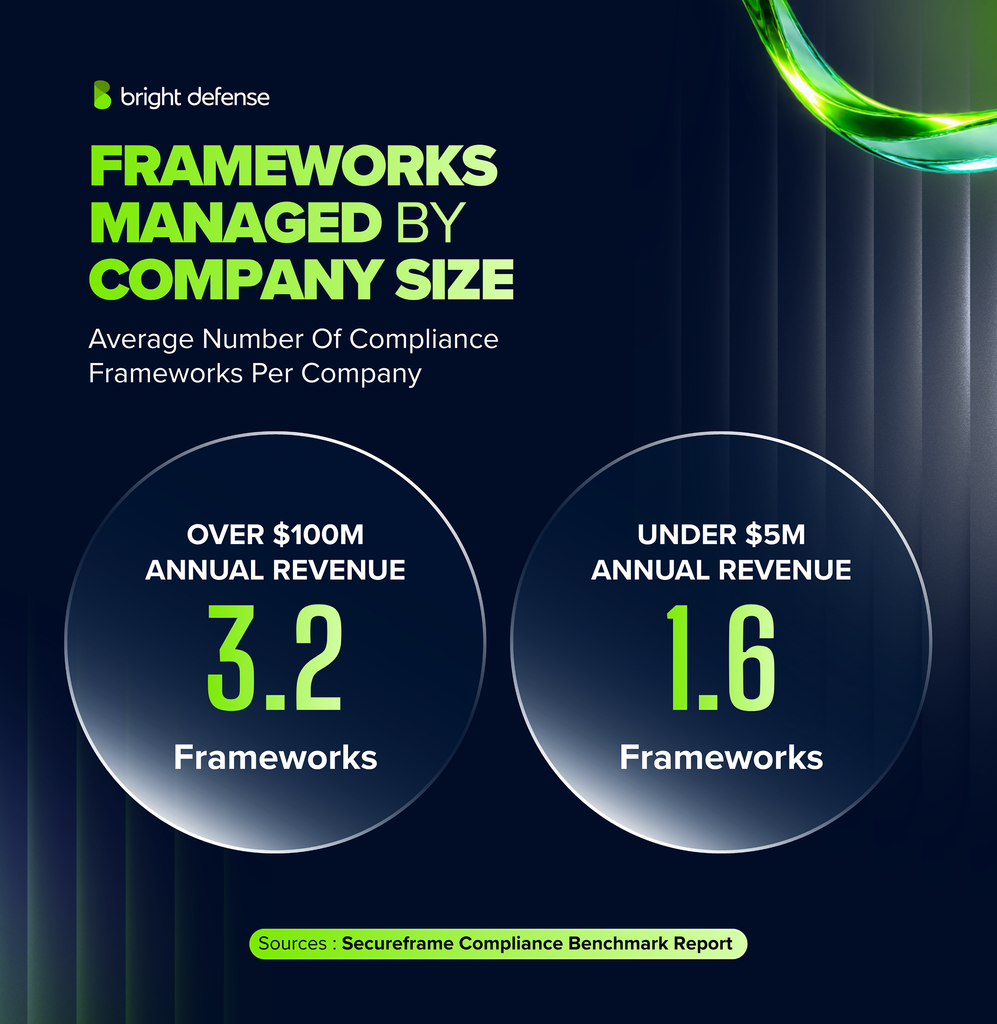
- Companies with more than $100 million in annual revenue manage an average of 3.2 frameworks, compared with 1.6 for companies under $5 million. (Source: Secureframe Cybersecurity and Compliance Benchmark Report 2026)
- Aerospace and robotics, transportation, and nonprofit organizations manage an average of 3 frameworks each, the highest industry averages in the survey. (Source: Secureframe Cybersecurity and Compliance Benchmark Report 2026)
- Government and public sector organizations manage an average of 2.25 frameworks. (Source: Secureframe Cybersecurity and Compliance Benchmark Report 2026)
- Healthcare organizations manage an average of 2.1 frameworks. (Source: Secureframe Cybersecurity and Compliance Benchmark Report 2026)
- 56% of surveyed organizations use a common controls framework to combine overlapping requirements from multiple regulations and standards. (Source: Hyperproof IT Risk and Compliance Benchmark Report 2026)
- 25% handle regional variation by applying the most rigorous applicable law across the whole organization. Other approaches: (Source: Hyperproof IT Risk and Compliance Benchmark Report 2026)
- A dedicated team for regional requirements: 12%
- Addressing each new regulation individually as it is enacted: 6%
- 72% of surveyed organizations achieve a new framework within one to six months. Full timeline distribution: (Source: Secureframe Cybersecurity and Compliance Benchmark Report 2026)
- One to three months: 35%
- Three to six months: 37%
- Six to nine months: 14%
- Nine to twelve months: 9%
- More than one year: 5%
- 12% name interpreting framework requirements as a leading compliance challenge. Related challenges: (Source: Secureframe Cybersecurity and Compliance Benchmark Report 2026)
- Keeping up with framework changes: 8%
- Determining which frameworks apply: 7%
- 60% of A-LIGN respondents work with the U.S. federal government. (Source: A-LIGN Compliance Benchmark Report 2026)
- 94% of surveyed organizations working with the federal government pursue CMMC, FISMA, FedRAMP, or GovRAMP compliance. (Source: A-LIGN Compliance Benchmark Report 2026)
SOC 2 Compliance Statistics
- SOC 2 examinations can cover 5 Trust Services Categories: Security, Availability, Processing Integrity, Confidentiality, and Privacy. (Source: AICPA Trust Services Criteria)
- 4 of the 5 categories are optional and added according to the organization’s services, risks, and customer requirements, with Security required in every SOC 2 examination. (Source: AICPA Trust Services Criteria)
- 82% of surveyed companies use SOC 2 audit reports in their third-party security assessment process. (Source: Whistic Third-Party Risk Management Impact Report 2025)
- SOC 2 audit preparation without automation takes 1 to 5 months, depending on organization size, control readiness, and outside support. (Source: Vanta SOC 2 Audit Cost)
- SOC 2 audit fees range from $10,000 to $50,000, depending on the auditor, company size, scope, and complexity. (Source: Vanta SOC 2 Audit Cost)
- Combined SOC 2 preparation and audit costs range from $10,000 to $80,000 or more once readiness assessments, security tools, consulting, and audit fees are counted. (Source: Vanta SOC 2 Audit Cost)
- A SOC 2 Type 1 engagement starts with 1 to 3 months of preparation. The remaining phases run as follows: (Source: Vanta SOC 2 Audit Timeline)
- Official audit work: 2 to 5 weeks
- Report creation and delivery: 2 to 6 weeks
- SOC 2 Type 2 observation windows commonly span 3, 6, 9, or 12 months, with first-time audits often using 3 months and later audits moving to annual periods. (Source: Vanta SOC 2 Audit Timeline)
- A SOC 2 Type 2 engagement needs 2 to 5 weeks of official audit review, plus 2 to 6 weeks of report preparation near or after the end of the observation period. (Source: Vanta SOC 2 Audit Timeline)
- More than 400 controls-assurance reports issued between 2021 and 2023 form KPMG’s sample. It includes SOC 1, SOC 2, AAF, and ISAE reports, so the following findings apply to the combined sample rather than SOC 2 alone. (Source: KPMG Controls Assurance Benchmarking Report 2024)
- 89% of operating-effectiveness testing exceptions in KPMG’s combined assurance-report sample involve manually operated controls. (Source: KPMG Controls Assurance Benchmarking Report 2024)
- System access controls produce 17% of all control exceptions while making up 8% of the controls tested. (Source: KPMG Controls Assurance Benchmarking Report 2024)
- 35% of system access controls are automated. (Source: KPMG Controls Assurance Benchmarking Report 2024)
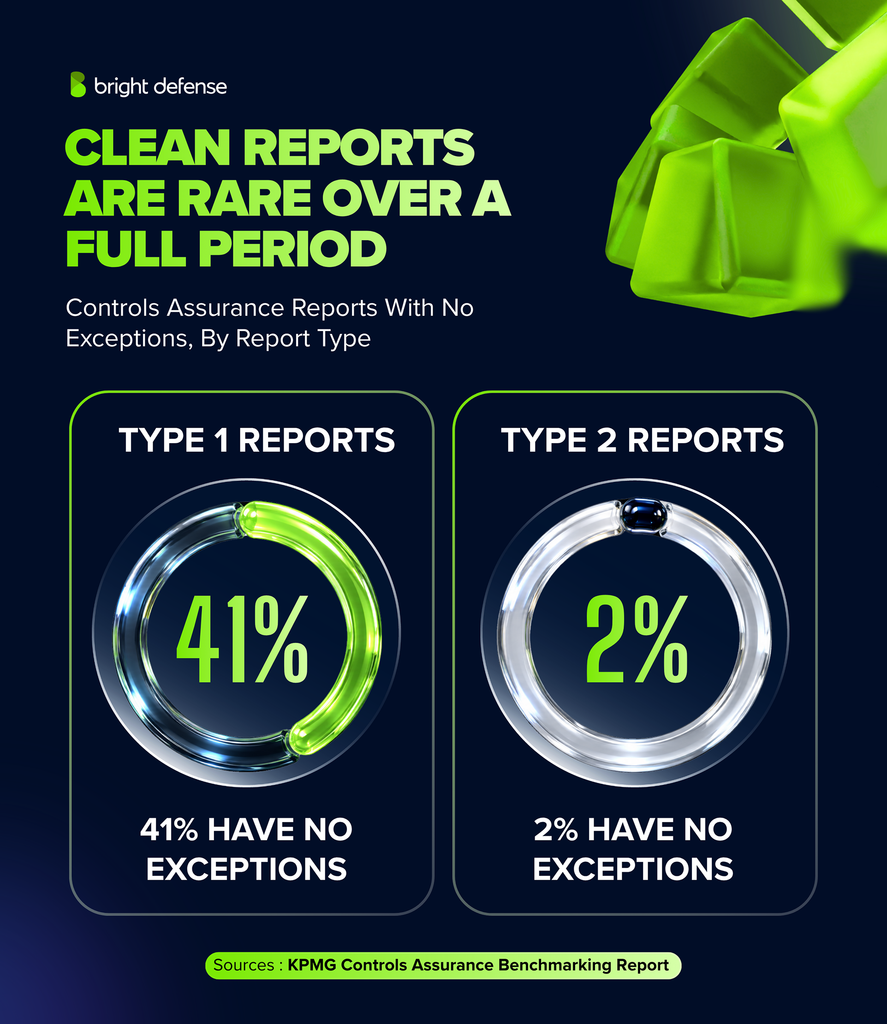
- 41% of Type 1 reports in KPMG’s combined sample contain no exceptions, compared with 2% of Type 2 reports. The two report types examine different aspects of controls, so these figures do not establish comparative audit quality. (Source: KPMG Controls Assurance Benchmarking Report 2024)
- About 20% of the controls assurance reports KPMG analyzed received qualified opinions. (Source: KPMG Controls Assurance Benchmarking Report 2024)
- Operating-effectiveness issues cause 83% of the exceptions behind qualified reports, compared with 17% from design or implementation issues. (Source: KPMG Controls Assurance Benchmarking Report 2024)
- Management review controls generate 30% of operating-effectiveness exceptions, ahead of authorization controls at 15%. (Source: KPMG Controls Assurance Benchmarking Report 2024)
For a fuller view of adoption, audit costs, timelines, and buyer expectations, explore our dedicated SOC 2 compliance statistics.
ISO 27001 Compliance Statistics
- 53% of surveyed organizations use ISO 27001 to manage compliance, one of the most common security and privacy frameworks in Hyperproof’s survey. (Source: Hyperproof IT Risk and Compliance Benchmark Report 2026)
- Certified organizations had until October 31, 2025 to complete their transition to ISO/IEC 27001:2022, and 2013 certificates that missed the date expired or were withdrawn. (Source: Cloud Security Alliance ISO/IEC 27001:2022 Transition Overview)
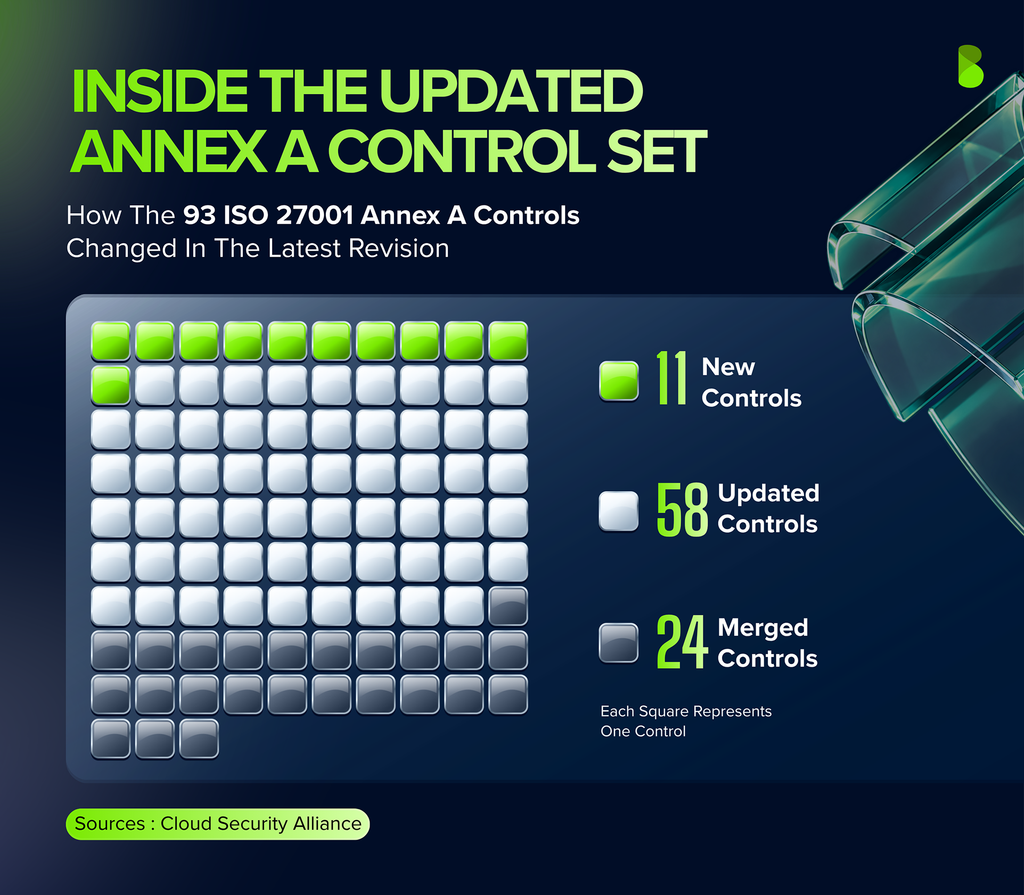
- ISO/IEC 27001:2022 cut the Annex A control set from 114 controls to 93. (Source: ANAB ISO/IEC 27001:2013 and 2022 Comparison)
- The 2022 revision introduced 11 new controls. Other changes to the control set: (Source: Cloud Security Alliance ISO/IEC 27001:2022 Overview)
- Updated controls: 58
- Merged controls: 24
- The 93 Annex A controls sit in 4 themes (Organizational, People, Physical, and Technological), replacing the 14 control domains of the 2013 edition. (Source: ANAB ISO/IEC 27001:2013 and 2022 Comparison)
- The core ISMS requirements remain in 7 clauses, Clauses 4 through 10. (Source: ANAB ISO/IEC 27001:2013 and 2022 Comparison)
- The ISO 27001 certification lifecycle runs through 5 stages: optional pre-assessment, Stage 1 audit, Stage 2 audit, surveillance audit, and recertification. (Source: A-LIGN ISO 27001 Certification Process)
- ISO 27001 certification takes 3 to 12 months, depending on organizational readiness, resources, and ISMS complexity. (Source: Vanta ISO 27001 Certification Timeline)
- Pre-audit preparation takes 1 to 4 months or longer, covering scoping, risk assessment, control implementation, internal auditing, and remediation. (Source: Vanta ISO 27001 Certification Timeline)
- Auditor selection, Stage 1, Stage 2, and certificate issuance take another 2 to 6 months. (Source: Vanta ISO 27001 Certification Timeline)
- ISO 27001 certification stays valid for up to 3 years, subject to annual surveillance audits and full recertification at the end of the cycle. (Source: Vanta ISO 27001 Certification Timeline)
- ISO 27001 certification costs range from $6,000 to more than $40,000, depending on company size, ISMS complexity, control maturity, and auditor. (Source: Vanta ISO 27001 Certification Cost)
- An external ISO 27001 gap analysis costs $5,000 to $8,000. (Source: Vanta ISO 27001 Certification Cost)
- Stage 1 and Stage 2 certification audits cost $14,000 to $16,000 when packaged together. (Source: Vanta ISO 27001 Certification Cost)
- Annual surveillance audits cost $6,000 to $7,500. (Source: Vanta ISO 27001 Certification Cost)
NIST Compliance Statistics
- 48% of surveyed organizations use or plan to use the NIST Cybersecurity Framework within the next 12 months. (Source: Hyperproof IT Risk and Compliance Benchmark Report 2026)
- Large organizations reach an average cybersecurity maturity level of 54% against NIST CSF 2.0 and ISO 27001, up 1 percentage point from the previous year. (Source: Wavestone Cyber Benchmark 2025)
- NIST CSF 2.0 organizes cybersecurity outcomes under 6 functions: Govern, Identify, Protect, Detect, Respond, and Recover, with Govern added in version 2.0 to cover leadership accountability, enterprise risk, policy, and supply chain oversight. (Source: NIST Cybersecurity Framework 2.0)
- NIST CSF 2.0 uses 4 implementation tiers: Partial, Risk Informed, Repeatable, and Adaptive. (Source: NIST Cybersecurity Framework 2.0)
- NIST SP 800-171 Revision 3 organizes CUI security requirements into 17 families. (Source: NIST SP 800-171 Revision 3)
- Revision 3 added 3 requirement families absent from Revision 2: Planning, System and Services Acquisition, and Supply Chain Risk Management. (Source: NIST SP 800-171 Revision 3)
- NIST released the final SP 800-172 Revision 3 and SP 800-172A Revision 3 on May 13, 2026, replacing the February 2021 enhanced CUI requirements and their assessment companion. (Source: NIST SP 800-172 Revision 3)
- SP 800-172A Revision 3 supports 3 assessment models: self-assessments, independent third-party assessments, and government-sponsored assessments. (Source: NIST SP 800-172A Revision 3)
- NIST SP 800-53 Revision 5 contains 20 security and privacy control families, including dedicated families for privacy and supply chain risk management. (Source: NIST SP 800-53 Revision 5)
- NIST published SP 800-70 Revision 5 on May 8, 2026, replacing the 2018 Revision 4 and mapping checklist settings to CSF 2.0 outcomes, SP 800-53 controls, and Common Configuration Enumeration identifiers. (Source: NIST SP 800-70 Revision 5)
- NIST published the final IR 8374 Revision 1 ransomware profile on June 11, 2026, mapping ransomware prevention, response, and recovery activities to CSF 2.0 outcomes. (Source: NIST Ransomware Risk Management Profile 2026)
- NIST finalized SP 800-18 Revision 2 on June 30, 2026, adding privacy plans and cybersecurity supply chain risk management plans to system security planning. (Source: NIST SP 800-18 Revision 2)
- 77% of higher education institutions treat NIST SP 800-171 compliance as a high or moderate priority. The split: (Source: EDUCAUSE NIST SP 800-171 QuickPoll 2025)
- High priority: 36%
- Moderate priority: 41%
- 54% of higher education institutions have a formal plan for meeting NIST SP 800-171 requirements. (Source: EDUCAUSE NIST SP 800-171 QuickPoll 2025)
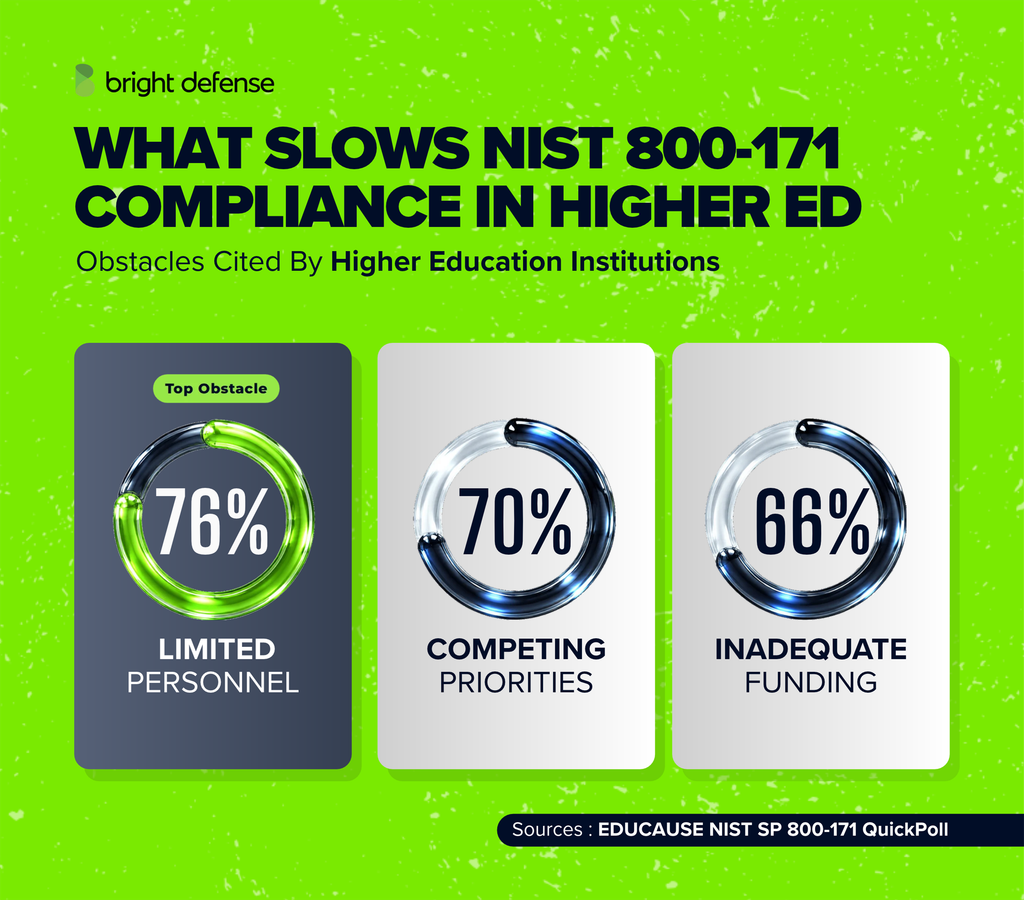
- Limited personnel obstructs NIST SP 800-171 compliance at 76% of institutions. Other obstacles: (Source: EDUCAUSE NIST SP 800-171 QuickPoll 2025)
- Competing priorities: 70%
- Inadequate funding: 66%
- Increased funding is the most requested internal resource for NIST SP 800-171 compliance at 78%. Other requests: (Source: EDUCAUSE NIST SP 800-171 QuickPoll 2025)
- More dedicated personnel: 76%
- Greater leadership support: 58%
PCI DSS Compliance Statistics
- PCI DSS applies to every merchant that stores, processes, or transmits cardholder data, regardless of company size or transaction volume, and payment brands decide the required validation method. (Source: PCI Security Standards Council Merchant Resources)
- Merchants that outsource all payment processing stay responsible for confirming provider compliance, documenting shared responsibilities, and reviewing service provider compliance every 12 months. (Source: PCI SSC Outsourced Payment Processing Guidance)
- PCI DSS v4.0.1, the only active version of the standard, adds 0 new requirements and removes none from v4.0, limiting its changes to wording, applicability, and guidance. (Source: PCI SSC PCI DSS v4.0.1 Announcement)
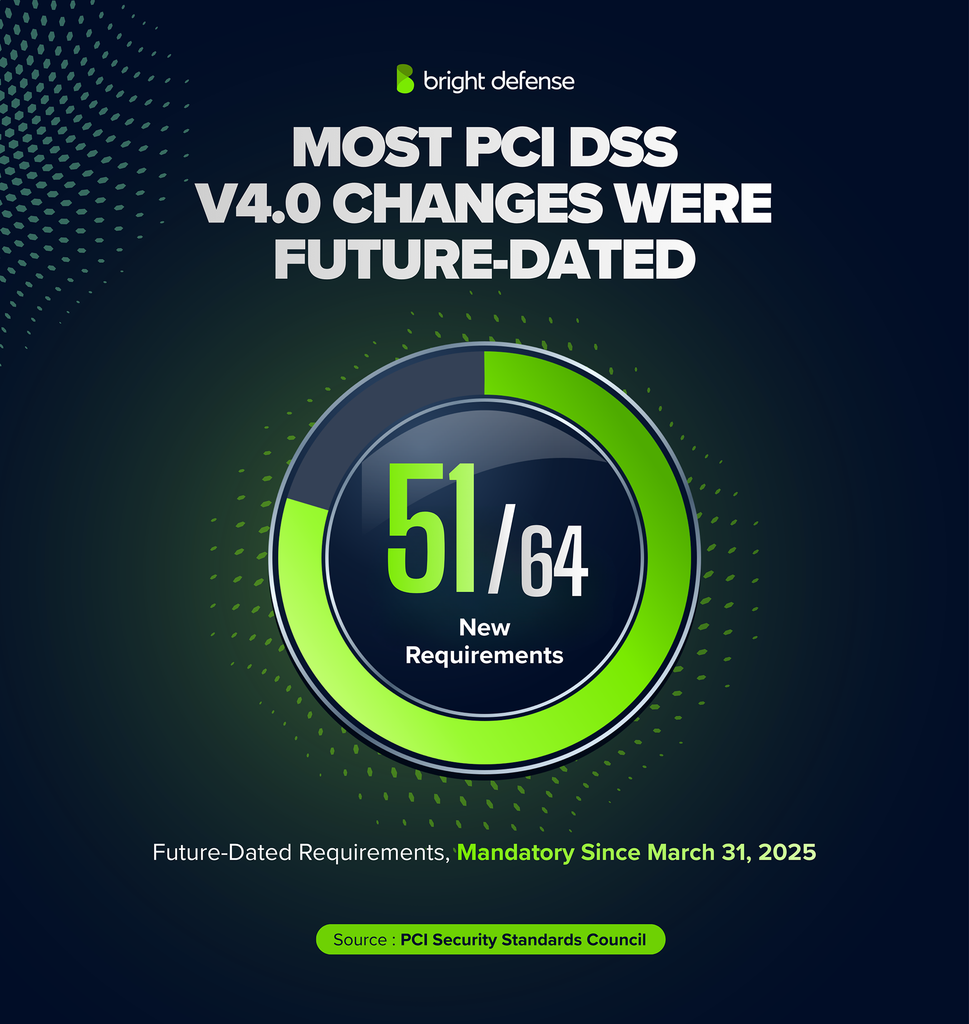
- PCI DSS v4.0 introduced 64 new requirements, including 51 future-dated requirements. (Source: PCI SSC Future-Dated Requirements Guidance)
- March 31, 2025 was the effective date for the 51 future-dated PCI DSS v4.0 requirements. Each requirement applies according to the organization’s scope and the relevant validation document. (Source: PCI SSC Future-Dated Requirements Guidance)
- PCI DSS v4.0.1 contains 12 principal requirements covering network security, secure configurations, account data protection, vulnerability management, access control, monitoring, testing, and security governance. (Source: PCI Security Standards Council PCI DSS Requirements)
- Requirement 6.4.3 requires organizations to authorize every payment-page script, verify its integrity, and keep an inventory explaining why each script is necessary, a direct defense against e-skimming. (Source: PCI SSC Payment Page Security and E-Skimming Guidance 2025)
- Requirement 11.6.1 requires change-detection controls that alert on unauthorized changes to payment-page content and HTTP headers. (Source: PCI SSC Payment Page Security and E-Skimming Guidance 2025)
- A January 2025 update removed 3 requirements (6.4.3, 11.6.1, and 12.3.1) from SAQ A and added an eligibility check confirming the merchant’s site is not vulnerable to script-based attacks; all three remain in the full standard. (Source: PCI SSC SAQ A Update 2025)
- The PCI Security Standards Council issued updated guidance on compensating controls and the customized approach in June 2026 for organizations meeting PCI DSS objectives with alternative control designs. (Source: PCI SSC Guidance 2026)
CMMC Compliance Statistics
- November 10, 2026 was the planned start of CMMC Phase II. The Department suspended those requirements on July 13, 2026 while reviewing the program; its CMMC program page states that Phase I self-assessment requirements remain in place. (Source: Department CMMC Program Update 2026)
- 2 self-assessment types, Level 1 Self and Level 2 Self, remain relevant during the CMMC review. Contractors should check the requirements and clause language in their actual solicitation or contract. (Source: Department CMMC Program Update 2026)
- A CMMC Reform Task Force received a 60-day mandate to review the program’s implementation, costs, and barriers for smaller contractors. (Source: Department of War CMMC Phase II Suspension Memorandum 2026)
- November 10, 2025 was the effective date of the final DFARS CMMC rule, which was published on September 10, 2025. The following framework facts describe the underlying rule; current contract application must account for the implementation pause and applicable deviations. (Source: DFARS CMMC Final Rule 2025)
- The DFARS rule created 2 principal CMMC contract provisions: DFARS 252.204-7021 and DFARS 252.204-7025. (Source: Defense Federal Acquisition Regulation Supplement)
- 4 assessment options appear in the underlying CMMC rule: Level 1 Self, Level 2 Self, Level 2 C3PAO, and Level 3 DIBCAC. This framework structure does not mean every option is currently required in solicitations during the implementation pause. (Source: Defense Federal Acquisition Regulation Supplement)
- The CMMC framework recognizes 7 assessment statuses, from Final Level 1 through Conditional and Final Level 3 DIBCAC. (Source: Defense Federal Acquisition Regulation Supplement)
- Conditional Level 2 and Level 3 statuses stay current for no more than 180 days, giving contractors time to close permitted gaps. (Source: Defense Federal Acquisition Regulation Supplement)
- Final Level 2 and Level 3 statuses stay current for 3 years, provided the contractor maintains compliance and submits annual affirmations. (Source: Defense Federal Acquisition Regulation Supplement)
- Contractors must affirm continuous compliance at least once every 12 months for each applicable contractor information system. (Source: Defense Federal Acquisition Regulation Supplement)
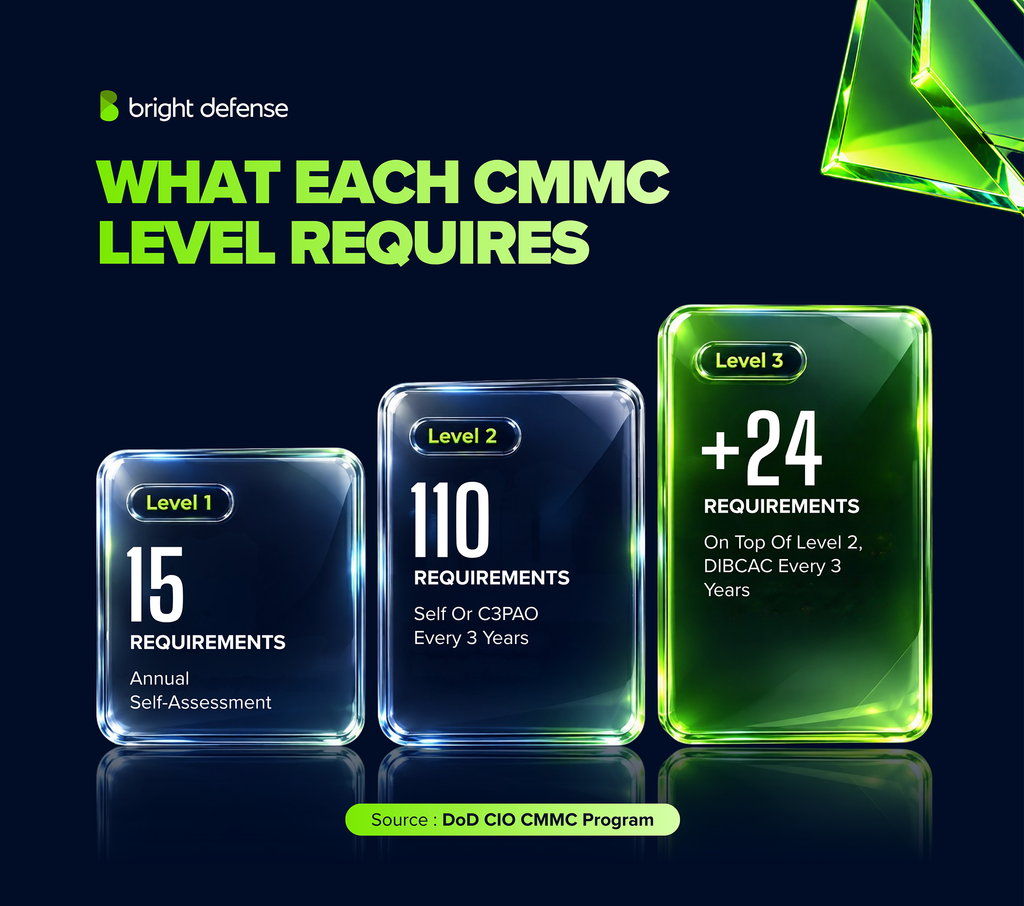
- CMMC Level 1 requires an annual self-assessment and affirmation against 15 security requirements from FAR 52.204-21. (Source: DoD Cybersecurity Resources)
- 110 security requirements from NIST SP 800-171 Revision 2 form the CMMC Level 2 baseline. The underlying framework provides for assessment every three years, with the applicable assessment route determined by contract requirements and implementation policy. (Source: DoD Cybersecurity Resources)
- 24 requirements selected from the February 2021 version of NIST SP 800-172 form the enhanced CMMC Level 3 baseline. Under the framework, Level 3 requires Final Level 2 status, a DIBCAC assessment every three years, and annual affirmation; current procurement application is subject to the implementation pause. (Source: DoD Cybersecurity Resources)
Our dedicated CMMC statistics bring together contractor readiness, assessment costs, and industry trends for a fuller picture of the defense compliance landscape.
HIPAA Compliance Statistics
- CMS received 140 HIPAA Administrative Simplification complaints during calendar year 2025. (Source: CMS CY 2025 Complaint Enforcement and Compliance Review Analysis Report)
- 3 transaction types drew the most Administrative Simplification complaints: the 835 Health Care Claim Payment/Advice, the 837 Professional Health Care Claim, and the 270 Eligibility, Coverage, or Benefit Inquiry. (Source: CMS CY 2025 Complaint Enforcement and Compliance Review Analysis Report)
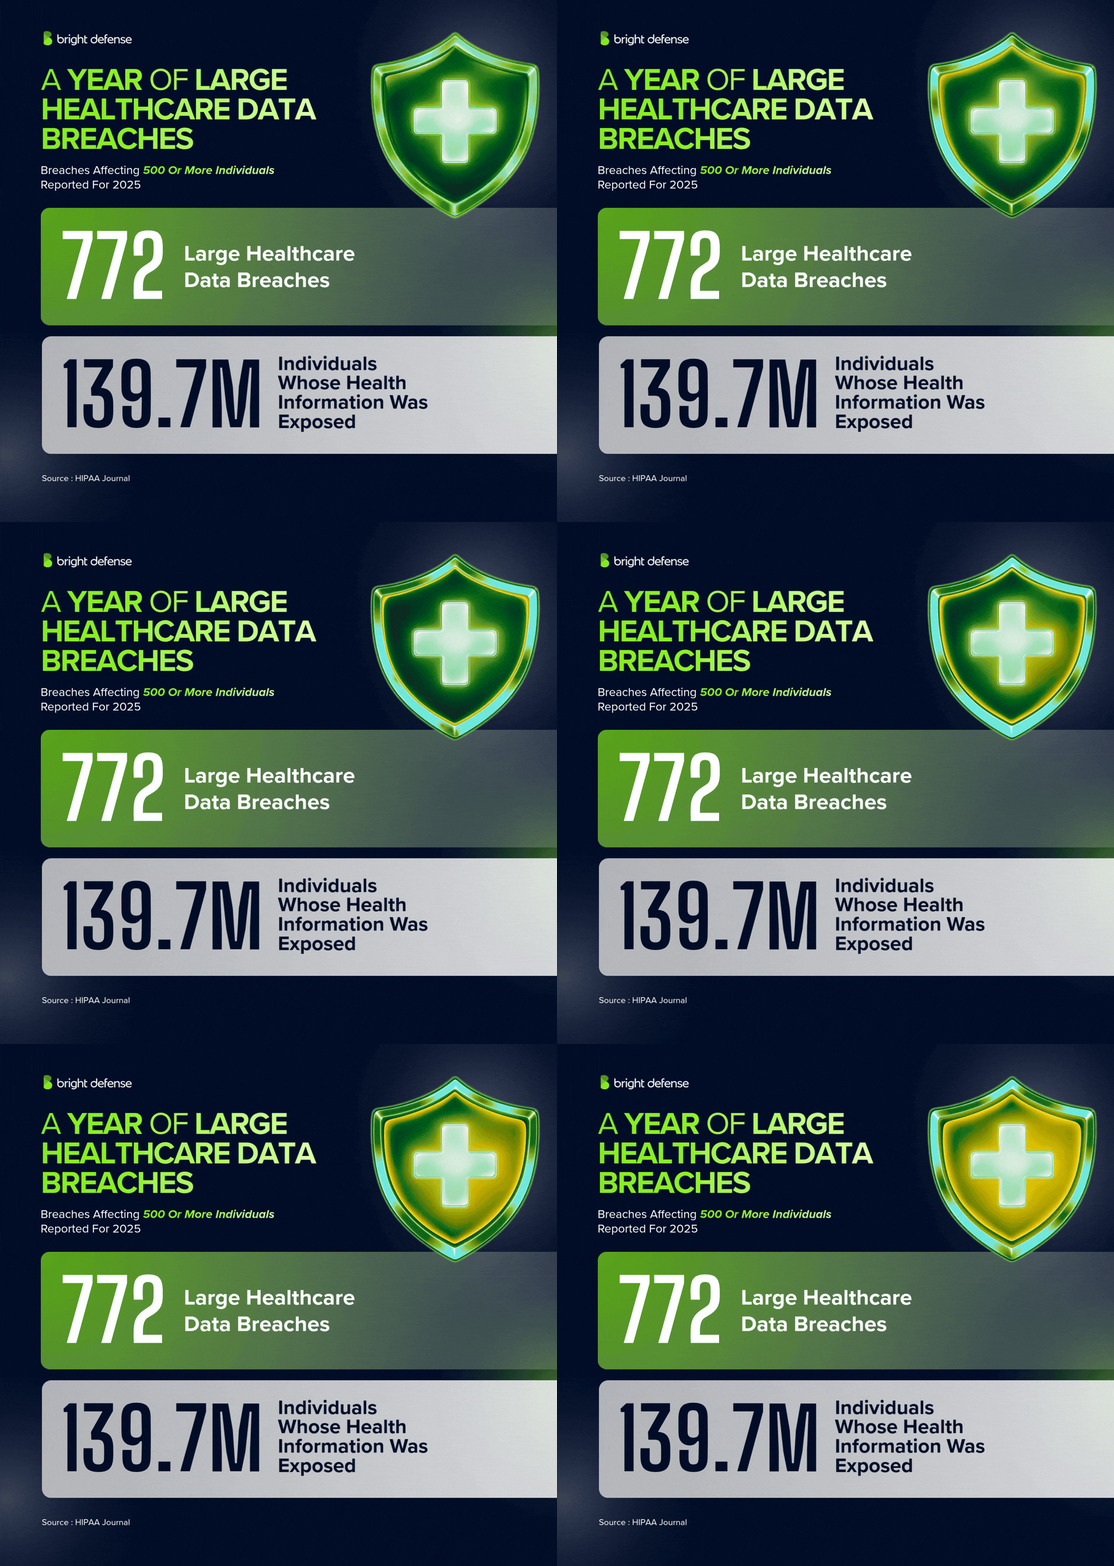
- 772 healthcare breaches affecting 500 or more individuals appear in HIPAA Journal’s compilation for 2025, using the HHS OCR portal as of June 2026. Later updates to portal entries can change the total. (Source: HIPAA Journal Largest Healthcare Data Breaches of 2025)
- 139,721,832 affected-individual entries are included in the large healthcare breaches compiled for 2025. Adding breach totals does not establish the number of unique people affected across all incidents. (Source: HIPAA Journal Largest Healthcare Data Breaches of 2025)
- 16 healthcare data breaches in 2025 affected more than 1 million individuals each. (Source: HIPAA Journal Largest Healthcare Data Breaches of 2025)
- 7 more 2025 healthcare breaches affected between 500,000 and 999,999 individuals each. (Source: HIPAA Journal Largest Healthcare Data Breaches of 2025)
- The largest healthcare data breach of 2025, at business associate Conduent Business Services, affected 62,224,658 individuals, the third-largest healthcare breach on record. (Source: HIPAA Journal Largest Healthcare Data Breaches of 2025)
- HIPAA Privacy responsibilities sit within the compliance office at 85% of healthcare organizations. (Source: SAI360 Healthcare Compliance Benchmark Report 2026)
- 38% of healthcare compliance offices hold responsibility for HIPAA Security or cybersecurity. (Source: SAI360 Healthcare Compliance Benchmark Report 2026)
- 30% of healthcare organizations have a single full-time or part-time compliance officer. (Source: SAI360 Healthcare Compliance Benchmark Report 2026)
- 35% of healthcare organizations run compliance teams of two to five employees. (Source: SAI360 Healthcare Compliance Benchmark Report 2026)
- 67% of healthcare organizations conduct formal compliance risk assessments every year. (Source: SAI360 Healthcare Compliance Benchmark Report 2026)
- 56% of healthcare organizations review or update compliance policies every year. (Source: SAI360 Healthcare Compliance Benchmark Report 2026)
- 18% of healthcare organizations update compliance policies only when necessary. (Source: SAI360 Healthcare Compliance Benchmark Report 2026)
- 85% of healthcare organizations have an executive-level compliance oversight committee. (Source: SAI360 Healthcare Compliance Benchmark Report 2026)
- 24% of healthcare respondents name keeping up with regulatory and enforcement changes as their top compliance program improvement priority. (Source: SAI360 Healthcare Compliance Benchmark Report 2026)
- About 20% of healthcare organizations use independent third parties as their main method for evaluating compliance program effectiveness, while about 60% rely on internal assessments. (Source: SAI360 Healthcare Compliance Benchmark Report 2026)
Explore More Security Statistics
Compliance benchmarks show how organizations manage requirements and evidence. For a closer look at testing adoption, security findings, and remediation, explore our penetration testing statistics.
Compliance Trends for 2026
- 71% of executives expect compliance teams to support digital transformation initiatives over the next three years. (Source: PwC Global Compliance Survey 2025)
- 41% expect compliance to support new business models over the next three years. (Source: PwC Global Compliance Survey 2025)
- 38% of surveyed organizations aim to reach a compliance leadership position within three years. (Source: PwC Global Compliance Survey 2025)
- 58% of surveyed companies that experienced a breach expect to spend more time on IT risk management and compliance during 2026. (Source: Hyperproof IT Risk and Compliance Benchmark Report 2026)
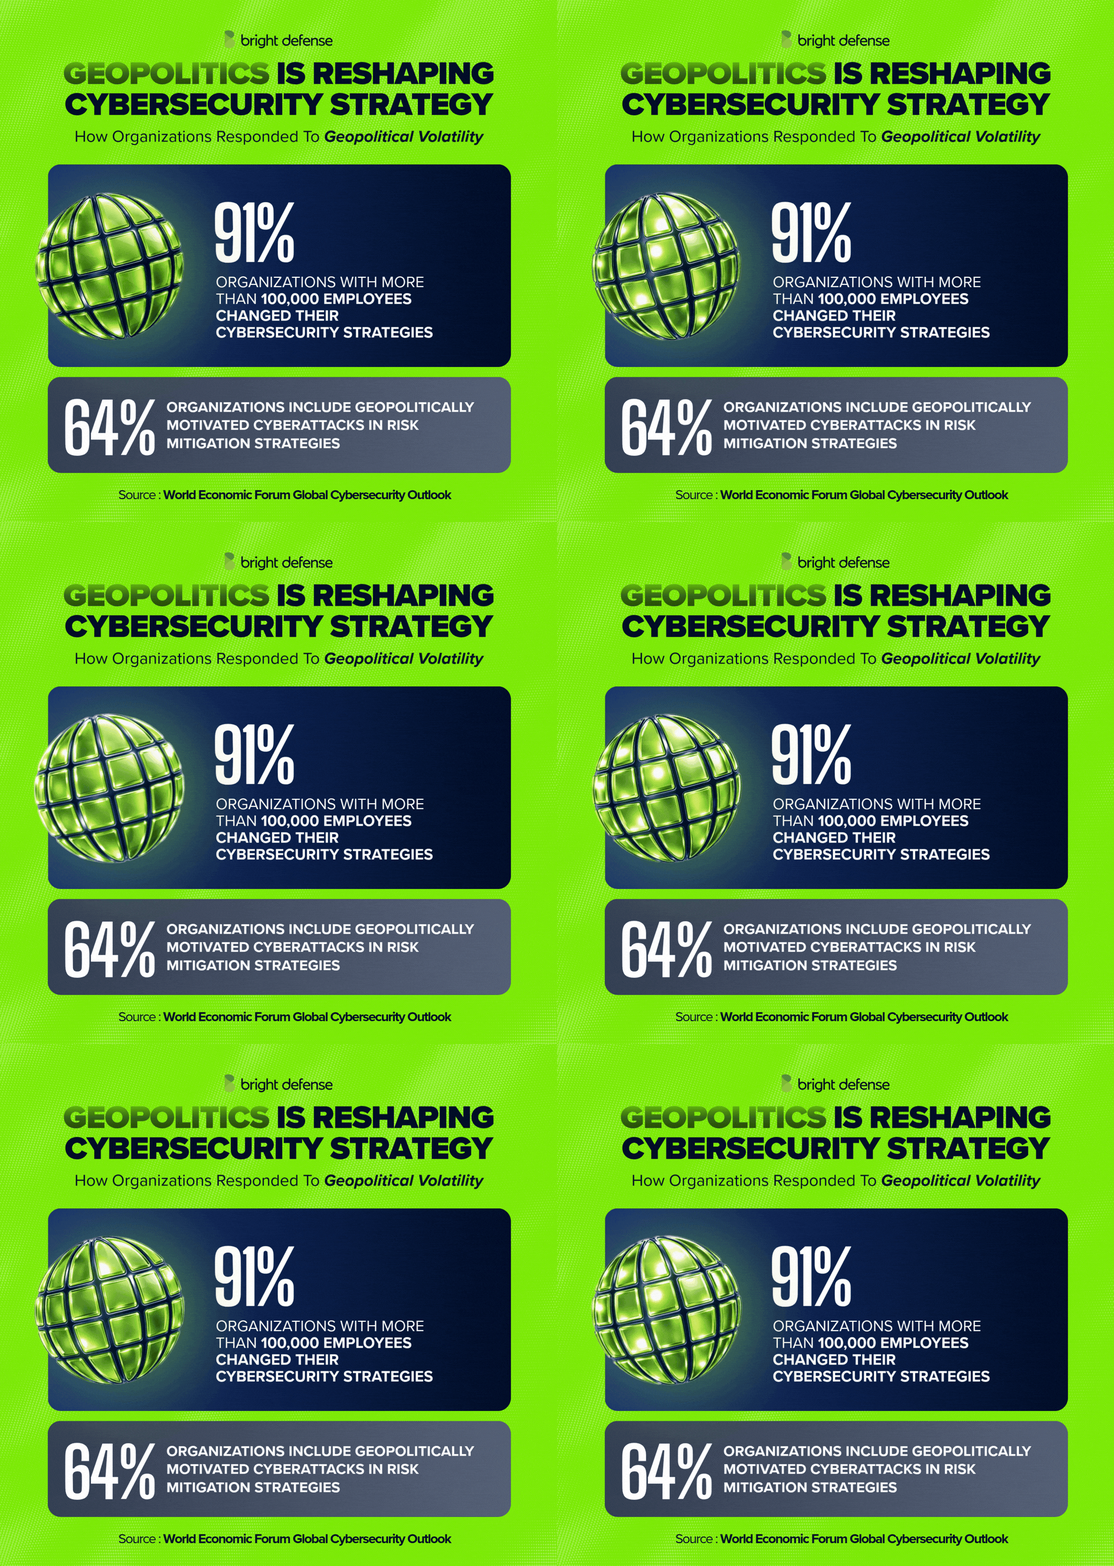
- 64% of surveyed organizations include geopolitically motivated cyberattacks in their risk mitigation strategies. (Source: World Economic Forum Global Cybersecurity Outlook 2026)
- 91% of surveyed organizations with more than 100,000 employees changed their cybersecurity strategies in response to geopolitical volatility. (Source: World Economic Forum Global Cybersecurity Outlook 2026)
- 25% of financial services firms expect geopolitical tensions to require significant changes to their compliance strategy. (Source: CUBE Cost of Compliance Report 2025)
- 8% of financial services firms believe geopolitical tensions could fundamentally alter their business models. (Source: CUBE Cost of Compliance Report 2025)
- 26% of surveyed organizations changed their risk assessments in response to shifting U.S. enforcement priorities. (Source: NAVEX State of Risk and Compliance Report 2026)
- 24% of surveyed organizations sought third-party compliance guidance or tools in response to shifting U.S. enforcement priorities. (Source: NAVEX State of Risk and Compliance Report 2026)
How Do You Measure Compliance Rate
Compliance rate is the percentage of applicable items that meet a defined requirement during a set period.
Compliance rate = (Compliant items ÷ Total applicable items) × 100
The following seven steps define a consistent metric and preserve the evidence behind it.
1. Define the Scope and Reporting Period
Pick one requirement or activity, the population it applies to, and the period you are measuring. A quarterly training metric, for example, covers every employee required to finish a specific course by that quarter’s deadline.
Keep training completion, control testing, and vendor reviews in separate metrics. Each one measures a different activity, and blending them hides weak spots.
2. Set the Counting Rules
Write down what qualifies as compliant before you look at results. For training, that might mean every module finished and a passing assessment score before the deadline.
The rules need to settle five edge cases in advance:
- Count each eligible item once.
- Record incomplete work separately, with partial credit only where the scoring method allows it.
- Flag missing evidence as a gap, never as an assumed pass.
- Treat not-applicable items according to the documented assessment rules.
- Separate late completion from on-time completion.
3. Collect and Validate the Evidence
Use records that directly support the metric: training completion logs, approved access reviews, or closed vendor assessment tickets. Assign a reviewer to check for duplicate entries, missing records, wrong dates, and changes in the eligible population.
Automated collection cuts manual entry, and the data it produces still needs that validation pass. For training metrics, reconcile the platform’s user list against the current list of employees required to take the course.
4. Calculate the Rate
Suppose 200 employees must finish training during a quarter and 180 finish by the deadline. The on-time training compliance rate is (180 ÷ 200) × 100 = 90%.
That result says 90% of eligible employees met one training deadline. It says nothing about the organization’s other obligations.
5. Apply Weighting Only Where It Adds Meaning
A weighted score gives selected requirements more influence. Document the weights and the reason for them before you calculate anything.
Weighted compliance rate = (Total weight of compliant items ÷ Total weight of applicable items) × 100
Three items weighted 5, 3, and 2, with the first two passing, produce a weighted score of 80%. Keep critical failures visible beside the score, since an internal target never turns an unmet obligation into an acceptable one.
6. Report the Result With Its Context
Publish the percentage alongside the underlying counts, the reporting period, exclusions, and missing evidence. Every failed item gets a corrective action, an owner, and a due date.
Compare only periods that use the same scope and counting rules. Flag any change in population or scoring method, so readers can separate real performance shifts from measurement shifts.
7. Monitor and Follow Up
Compliance monitoring connects review intervals to evidence, alerts, and follow-up work. Set review intervals and alerts according to each requirement’s deadlines, risk, and data availability. Overdue training, missed access reviews, and incomplete vendor assessments make good triggers.
Route each exception to an accountable owner and verify the fix before you change its status. Keep the original result on record, so a late completion never erases a missed deadline.
For programs that require a plan of action and milestones (POA&M), keep corrective actions tied to the required deadlines and evidence.
What Do These Compliance Statistics Mean for Your Organization
The figures highlight five areas where organizations can improve compliance operations. The following recommendations translate those findings into practical work; review frequencies and delivery targets should reflect your obligations, risks, and available resources.
1. Treat Compliance Evidence as Sales Infrastructure
62% of respondents in Secureframe’s benchmark need compliance to win or renew contracts, and 47% say a lack of certification delayed sales. Whistic’s separate survey finds that 82% use SOC 2 reports during vendor assessment. Current evidence therefore supports procurement and sales reviews.
Maintain an evidence library containing the current SOC 2 report or ISO 27001 certificate and relevant supporting documents, core policies, a penetration test summary, and approved questionnaire answers. Assign an owner for custom requests and set a response target your team can meet. Evaluate a trust center by the staff time it saves and its operating cost, rather than by questionnaire deflection alone.
Track three numbers: average questionnaire turnaround, the count and value of deals delayed by security review, and the share of requests answered straight from the library.
2. Build One Control Library for Every Framework
In A-LIGN’s benchmark, 97% conduct at least two audits a year, 90% use multiple audit partners, and 99% believe audit consolidation could save time or money. In KPMG’s broader assurance-report sample, manually operated controls account for 89% of operating-effectiveness exceptions.
Map overlapping SOC 2, ISO 27001, HIPAA, and customer requirements to a shared control library with accountable owners. Preserve any requirements that differ in scope, evidence, or assessment period. Prioritize access reviews, logging, and configuration checks according to risk, and agree evidence periods with auditors where the engagements allow it. A SOC 2 controls list can help teams connect each safeguard to its owner and supporting evidence.
Three numbers show whether consolidation worked: the share of evidence reused across two or more frameworks, audit preparation hours per framework, and repeat findings from one cycle to the next.
3. Govern AI Before the Next Buyer Asks
Hyperproof’s survey finds that 97% of GRC professionals use AI in part of their workflow. In Vanta’s separate survey, 44% have a company AI policy and 48% have a framework for agentic AI autonomy. A-LIGN finds that 80% of organizations using AI face customer questions about AI risk management. These samples measure different populations and should not be treated as a single adoption-to-governance gap.
Inventory AI tools, including AI features embedded in existing SaaS, and assign an owner and completion date. Classify use cases by data sensitivity and decision impact. Define which outputs need human review, restrict agent permissions, and add relevant AI questions to vendor assessments. ISO 42001 can guide an AI management system when its scope fits your organization.
Your AI scorecard needs the share of AI systems in the inventory, the share of high-impact use cases with a completed risk assessment, and the number of AI vendors reviewed.
4. Tier Vendors and Review Them After Onboarding
In Whistic’s survey, 77% of breaches at surveyed companies over the preceding three years originate with a third party. Its respondents work with an average of 286 vendors and have an average TPRM team of 8.5 people. Separately, the World Economic Forum finds that 33% fully map their supply chain cyber exposure.
Tier vendors by data access, privileges, service criticality, and potential impact. Give high-risk vendors deeper assessments and more frequent monitoring, and define lighter reviews for lower-risk relationships. Agree incident notification deadlines, subprocessor disclosure, and audit rights according to applicable obligations and service risk. Track vendor OAuth grants, API tokens, and service accounts alongside the contracts.
Track the share of vendors tiered, the share of Tier 1 vendors with a current assessment, overdue vendor findings, and average vendor remediation time.
5. Report Outcomes Next to Activity
In NAVEX’s survey, 98% measure program effectiveness. LRN’s separate study finds that 29% use analytics tools to evaluate ethics and compliance performance. These measures come from different samples, but together they support closer attention to how programs assess their results.
The following examples pair an activity metric with a related outcome or risk indicator. Interpret each pair in context: more hotline reports, for example, can reflect greater confidence in reporting rather than worsening conduct.
| Activity Metric | Outcome or Risk Indicator |
|---|---|
| Training completion rate | Repeat policy violations and phishing simulation failure rate |
| Controls tested | Control failure rate and average remediation time |
| Vendor assessments completed | Unresolved critical vendor risks |
| Hotline availability | Reports per 100 employees and anonymous reporting share |
| Audits completed | Repeat findings across audit cycles |
Keep the board report concise. Include the most significant open exceptions, trends in the metrics above, overdue corrective actions, and decisions that require leadership approval.
Build a Continuous Compliance Program With Bright Defense
Security controls, employees, vendors, and business requirements change between audits. Continuous compliance keeps ownership, evidence, and remediation work active throughout the year.
Bright Defense’s monthly engagement model combines security expertise with managed compliance automation. We help organizations prepare for assessments and maintain their security programs as systems and requirements change.
Our continuous compliance service includes the following:
- Gap analysis and compliance planning
- Cybersecurity risk assessments
- Policy development and implementation
- Control remediation
- Business continuity planning
- Audit and certification assistance
- Managed compliance automation
- Continuous monitoring of compliance status
- Security awareness training and phishing simulations
We support SOC 2, ISO 27001, HIPAA, and CMMC readiness and ongoing compliance work. Our team helps maintain visibility into control status, evidence, and remediation priorities.
Bright Defense works with startups, small and midsize businesses, SaaS providers, and managed service providers. Talk to our team about a continuous compliance program tailored to your requirements.
Explore Bright Defense’s continuous compliance service or contact our team.
Compliance Statistics FAQs
The questions below cover the figures readers ask about most, from audit counts to SOC 2 costs.
What Are the Most Important Compliance Statistics for 2026
Three useful benchmarks are rising complexity, audit workload, and lost business. In PwC’s 2025 survey, 85% of executives see increasing complexity. In A-LIGN’s 2026 benchmark, 97% conduct at least two audits annually. In Secureframe’s benchmark, 38% lose revenue or bids because they cannot provide adequate compliance assurance.
How Many Compliance Audits Do Organizations Run Each Year
97% of respondents in A-LIGN’s 2026 benchmark conduct at least two compliance audits annually. Within its 1,001+ employee category, 74% conduct four or more. These are survey benchmarks, not required audit frequencies for every organization.
How Does Compliance Affect Revenue
62% of respondents in Secureframe’s full-data appendix say compliance is required to win or renew contracts, and 47% say a lack of certification delays sales. A-LIGN’s separate study links SOC 2 and ISO 27001 with customer revenue, but those survey averages are not guaranteed returns for an individual business.
How Many Organizations Use AI in Compliance
97% of GRC professionals in Hyperproof’s 2026 survey use AI for at least part of their workflow. That figure does not mean 97% of all organizations have automated compliance programs. Vanta’s 2025 survey separately finds that 44% have a company AI policy and 45% conduct regular AI risk assessments.
What Percentage of Compliance Work Is Still Manual
76% of risk and compliance teams in Hyperproof’s 2026 survey spend at least 30% of their time on repetitive manual or administrative work. In Diligent’s separate legal entity governance survey, 53% handle more than 60% of their workload manually. The measures cover different functions and populations.
How Much Does SOC 2 Compliance Cost
SOC 2 audit fees run from $10,000 to $50,000, and preparation plus the audit can pass $80,000 once readiness work, tools, and consulting are added (Vanta). Scope, company size, and the number of Trust Services Categories you include drive the final figure.
What Are the 7 Pillars of Compliance
The U.S. Sentencing Guidelines describe seven minimum elements of an effective compliance and ethics program. The following list summarizes those elements; it is broader than a cybersecurity control framework:
- Written standards and procedures
- Board and senior leadership oversight, with a designated compliance officer
- Due care in delegating authority, including screening out people with a history of misconduct
- Training and communication
- Monitoring, auditing, and a confidential reporting channel
- Consistent incentives and discipline
- Response to violations and corrective action
HHS OIG uses a closely related seven-element model in its General Compliance Program Guidance for healthcare organizations.
Which Cybersecurity Compliance Framework Should I Use
Choose frameworks according to your contracts, customers, data, industry, and legal obligations. SOC 2 supports customer assurance through a CPA examination, ISO 27001 addresses an information security management system, HIPAA applies to covered entities and business associates, PCI DSS addresses payment account data, and CMMC applies through relevant defense-contract requirements. NIST publications support different security programs and should be identified by publication and revision.
Is Compliance a KPI
Compliance can be measured through several KPIs, including control pass rate, overdue findings, remediation time, training completion, vendor assessment coverage, and evidence collection time. Define each metric’s scope and counting rules, then pair activity measures with indicators of control performance and risk.
Most programs map to the seven elements from the U.S. Sentencing Guidelines, which guide organizations across various industry sectors:
1. Standards and procedures that reflect the current compliance landscape
2. Leadership and oversight from the board and a compliance officer who manage cyber security and ethical accountability
3. Due care in authority, including screening of personnel with significant challenges or roles of high responsibility
4. Training and communication addressing social engineering and emerging technologies
5. Monitoring, auditing, and reporting, often constrained by inadequate resources or reliance on manual processes
6. Incentives and discipline that encourage responsible conduct and support operational resilience
7. Response and corrective action when issues occur, including third party due diligence
Names vary across industries, yet the substan
Many teams use a simple cycle, often mirroring PDCA, though most organizations now manage compliance manually:
1. Plan: Assess risk, address unprecedented complexity, and design controls and standards suitable for diverse industry sectors.
2. Do: Implement policies, systems, and training to reduce cyber security risk.
3. Check: Monitor and review results to spot gaps in manual processes and measure global averagecost trends.
4. Act: Investigate issues, improve guidance, and reinforce operational resilience through smarter automation.
This cycle repeats, which keeps the program current as risks change.
An accountability checklist is a structured tool that helps track commitments, responsibilities, and progress in the compliance landscape. It lists key behaviors or tasks linked to accountability, such as defining expectations, monitoring outcomes, giving feedback, and following up. Risk leaders often use it to measure how effectively individuals meet their responsibilities, especially when managing manual processes or third party due diligence.
The four main principles are:
– Responsibility / Ownership: Accepting responsibility for assigned duties and results in complex compliance landscapes.
– Transparency / Clarity: Keeping expectations, actions, and progress visible across industry sectors.
– Answerability / Explanation: Being ready to explain decisions, including cyber security responses.
– Consequences / Recourse: Rewarding success and addressing failure while maintaining operational resilience.
The five common steps for building accountability are:
1. Clarity and Authority: Define expectations, success measures, and timelines in an environment shaped by unprecedented complexity.
2. Agreement: Confirm that all participants understand their roles, especially within industry sectors facing significant challenges.
3. Track and Post: Monitor progress and share updates on issues such as global average cost and third party due diligence.
4. Coach, Mentor, and Train: Provide support to strengthen operational resilience and prepare teams for emerging technologies.
5. Reward Success or Address Failure: Recognize when most organizations adapt effectively despite inadequate resources.
Add Bright Defense as a Preferred Source on Google